
Project

WalkGrid: personalising urban walking through environmental similarity

A routing platform that curates walks by what makes them worth taking, from greenspace and heritage to air quality and safety, rather than by distance. 51 environmental features scored across a hexagonal grid, with route selection driven by natural language.

Period

2020 to 2024

Status

Active

Role

Lead developer and researcher

Areas

H3 · PostGIS · OSRM · LLM · Spatial similarity · Active travel · HCI

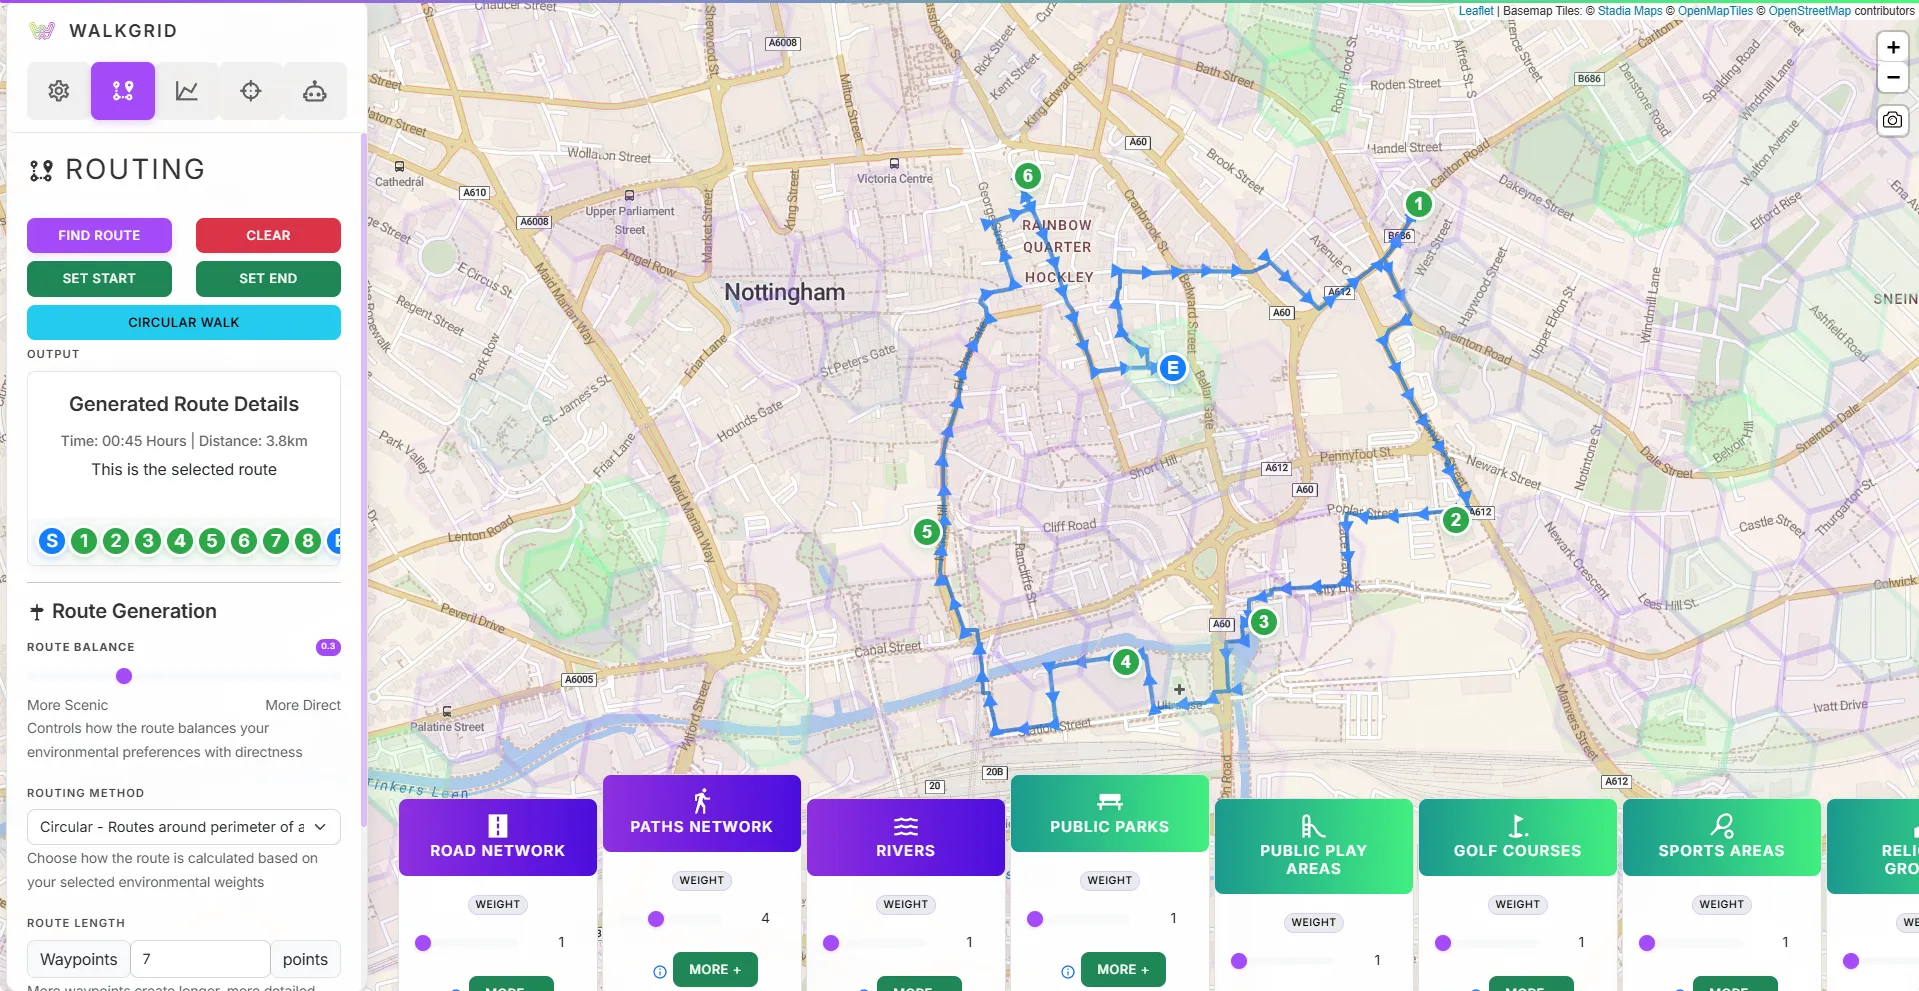
The WalkGrid routing interface showing a generated circular walk through Nottingham, with the environmental feature selector panel along the bottom.
Figure

The routing interface. A 3.8 km circular walk through Nottingham, generated from weighted environmental preferences rather than from shortest path.

  • 51Environmental featuresTransport, greenspace, land use, terrain, safety, air quality, heritage and amenities, all normalised to a common scale.
  • H3Spatial indexResolution 10. Hexagons roughly 150 m across, uniform in area and hierarchically aggregable.
  • 3Similarity metricsCosine, Euclidean and Manhattan, each weighted by user-specified feature importance.
  • 2Evaluation studiesA think-aloud study of the slider interface, then a study of LLM-mediated preference elicitation.

The brief

Every routing system in common use answers the same question: what is the shortest path from here to there. It is a good question for a delivery van and a poor one for a walk. Two kilometres along an arterial road and two kilometres through a park are identical to a router and nothing like each other to a person, and that difference is most of the reason anybody walks for pleasure at all.

Walking is not only transport. It carries physical health, mental wellbeing, social contact and attachment to place, and planners increasingly accept that a walkable city needs more than pavements that connect. It needs walks worth taking. But the qualities that make a route worth taking are exactly the ones routing engines discard, because they are qualitative, contested and hard to put in a cost function.

WalkGrid exists to put them in the cost function anyway. The wager is that enough of what makes a place good to walk through can be measured, and that somebody who wants a green quiet walk with a couple of listed buildings on it should be able to ask for that and get it.

The insight

The organising idea is environmental similarity: two places offering comparable experiences will have comparable environmental profiles. Tile the city, score every tile across enough dimensions, and “find me somewhere like this” becomes a distance computation in a 51-dimensional space. The argument for treating walking context this way is set out in a spatial-platial vision paper, and the recommendation model it produced in an emerging conceptual model.

That reframing does real work. Route curation stops being an optimisation problem with one right answer and becomes a search problem with many defensible ones, ranked by a preference the user actually stated. It also makes the system honest. Because the weights are explicit and the features are named, you can always ask why a route was proposed and get an answer.

The harder discovery came from evaluation. The V1 study confirmed the model and condemned the interface. People do not think in fifty-one features. They had already told us as much in a survey of leisure walking behaviours and in the platial narratives that came out of the walking study. They think in phrases: somewhere green, not too busy, interesting to look at. Asking them to decompose a phrase into weighted sliders imposed exactly the cognitive work the system was supposed to remove. The abstraction gap was not a usability detail. It was the thing standing between a working model and a usable tool.

V2 puts a language model in that gap. The user says the phrase, the model performs the decomposition. Crucially the mapping stays visible, because the selected features and inferred weights are shown and can be corrected, so the model acts as a translator rather than an oracle.

What it does not do

It inherits the quality and the currency of its sources. A crime statistic and an air quality reading age at different rates, and the grid does not currently distinguish between them. It cannot measure the things people most often name: quietness, beauty and feeling safe are proxied by lighting, CCTV and road density, which is not the same thing and should not be mistaken for it.

It has no detailed accessibility layer. There are no kerb cuts, gradients are rendered only as elevation variance, and there is no step-free guarantee, which limits its usefulness for precisely the walkers with the least margin for a bad route. It also covers one city. Extending to another is a data pipeline problem rather than a research one, but it is not free.

The equity risk is worth stating plainly. A system that surfaces the most pleasant environments will, without care, route people away from places that are already under-invested in, and reinforce the pattern it is measuring.

The full argument, including the evaluation studies in detail, is in the thesis: A Framework for Curating Personalised Leisure Walking Experiences. The wider standards problem this work kept running into became its own project, the Leisure Walking Systems Working Group.


How it works

5 stages
  1. 01

    Score every hexagon

    Nottingham is tiled at H3 resolution 10 and each cell is scored across 51 environmental indicators drawn from Ordnance Survey, local authority open data, air quality monitoring networks, police crime statistics and OpenStreetMap.

    Road, path and river density · parks, play space, allotments, sports grounds · tree cover, water, wetland, built area, grassland · elevation variance · crime at 1, 6 and 12 months · CCTV, street lighting · listed buildings, plaques · PM10, NO2 · food, drink, retail, transport, tourism.

  2. 02

    Normalise to a common scale

    Indicators arrive in incompatible units, including counts, densities and micrograms per cubic metre. All 51 are min-max normalised to [0, 1] so that distance-based comparison is meaningful and a user-supplied weight means the same thing across every dimension.

    Without this, air quality measured in µg/m³ would silently dominate any Euclidean comparison against a tree count.

  3. 03

    Compare places by feature vector

    Similarity between two cells is the distance between their 51-dimensional vectors. Three metrics are offered because they answer different questions. Cosine cares about the balance of features, Euclidean about absolute difference, Manhattan about robustness to outliers.

    User weights are normalised and applied multiplicatively to the vectors before the distance is computed, which keeps preference expression interpretable rather than buried in a scoring heuristic.

  4. 04

    Constrain the search geographically

    A place can be environmentally perfect and forty miles away. Similarity search is bounded to cells within a specified H3 ring distance, with PostGIS performing geodesic filtering, so results are both a good match and actually walkable to.

    This hybrid semantic and spatial filter is what separates the system from a recommender that ignores geography and a router that ignores context.

  5. 05

    Route through the matches

    Matched cells are candidates, not a walk. OSRM builds pedestrian routes through a selected sequence over the OpenStreetMap footway network, supporting point-to-point and circular walks, with the environmental overlay kept visible so the route can be refined in place.

    Routing runs on real pavements and paths, not a straight line between hexagon centroids.

Figures

Fig. 1

Preference weighting rendered live. As feature weights are adjusted, the H3 overlay re-scores across the city, so the abstract act of saying "more greenspace, fewer main roads" becomes something you can watch happen to the map.

Fig. 2

Circular route generation from a single point. Most walks are not journeys between two places. They start and end at the door, which is a different routing problem from the one navigation apps solve.

Fig. 3

Place similarity matching. Selecting one hexagon as a reference surfaces every cell in range whose 51-dimensional profile resembles it. This is the operational core of the system, and the part that turns route planning into curation rather than optimisation.

Fig. 4

Point-to-point recommendation in dark mode. Where an origin and destination are fixed, preference weighting shifts from choosing the destination to choosing which of many viable paths between two points is worth walking.

Fig. 5

V2 preference elicitation. The user describes the walk they want in ordinary language. The assistant identifies which of the 51 features that implies, infers relative weights, and adds them to the query, showing the selection as it goes so the translation stays inspectable rather than becoming a black box.

Outcomes

  • The model worked, the interface was the barrier

    The V1 think-aloud study confirmed that similarity-based matching aligns with how people actually think about places, and that users reason in high-level terms such as "green and quiet" rather than in features. The checkbox-and-slider interface demanded the opposite, and decision fatigue drove shallow engagement. A validated model behind an unusable control surface is still an unusable system.

  • Natural language closed the abstraction gap

    V2 replaced manual weighting with conversational elicitation. Users describe the walk they want, and a language model performs intent recognition, maps the description onto feature columns, infers relative weights, and refines them across turns. The feature space did not change. Only the way people reach it did.

  • Environmental similarity, made operational

    The project provides a reproducible and extensible framework for quantifying how alike two places are across multivariate environmental indicators. New features such as noise, thermal comfort or sentiment can be added without architectural change.

  • Semantic and spatial constraints, resolved together

    Combining similarity search with geodesic filtering addresses a persistent problem in location-based systems, which tend to optimise for relevance or for proximity but rarely for both at once.

Stack

Languages
Python, JavaScript, SQL
Spatial
Uber H3 resolution 10, PostGIS, ST_DWithin geodesic filtering, Leaflet
Routing
OSRM (Open Source Routing Machine), OpenStreetMap pedestrian network
Similarity
Cosine, Euclidean, Manhattan, weighted min-max normalisation
Language models
Google Gemini API, intent recognition, weight inference
Evaluation
Think-aloud protocol, interaction logging, NASA-TLX, SUS, semi-structured interviews

Partners

Project team

  • Dr James PinchinUniversity of Nottingham
  • Dr Adrian HazzardUniversity of Nottingham
  • Dr Gary PriestnallUniversity of Nottingham
  • Prof. Sarah SharplesUniversity of Nottingham
  • Dr Andrea BallatoreKing's College London
  • Dr Stefano CavazziOrdnance Survey
  • Lee NewtonOrdnance Survey
  • Engineering and Physical Sciences Research Council
  • Ordnance Survey
  • Horizon Centre for Doctoral Training
  • University of Nottingham

This work was supported by the Engineering and Physical Sciences Research Council [grant number EP/S023305/1] and by Ordnance Survey.

Work like this

Start a
conversation →

Available for consulting engagements and research collaborations at this scale. Email james@jameswil.com.