Project

WalkGIS: linking video narratives to maps to capture sense of place

A contextual GIS that fuses first-person walk video, think-aloud narration and GPS into one synchronised environment, so what a walker said can be queried spatially. Analysis per walk fell from two or three weeks to one.

Period

2020 to 2024

Status

Complete

Role

Lead developer and researcher

Areas

Leaflet · Turf.js · JavaScript · Platial analysis · Qualitative GIS · HCI

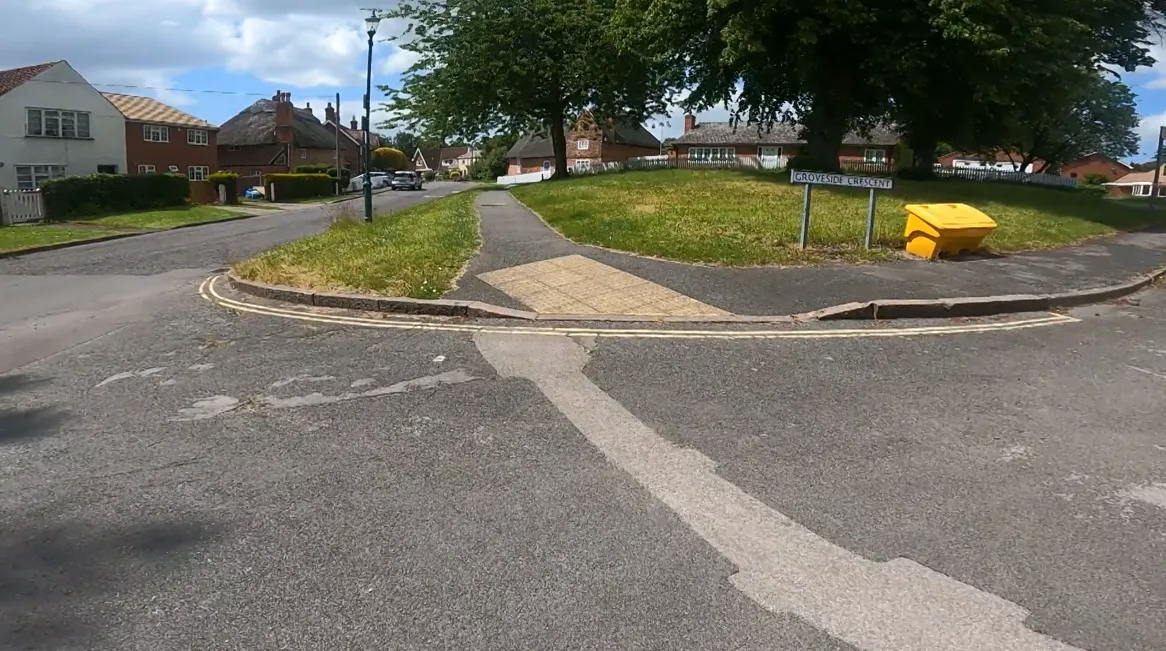
A first-person frame from a recorded walk, looking across grass and trees towards campus buildings under a cloudy sky.
Figure

The raw material. A frame from a participant's walk, recorded alongside their think-aloud narration and GPS trace, which together are what the tool exists to keep in step.

  • 3wk → 1wkAnalysis per walkTwo to three weeks of manual work per walk, reduced to one week and largely automatic.
  • 4Coordinated viewsVideo, map, transcript and analytics, synchronised bi-directionally rather than sitting in separate windows.
  • 0Cloud uploadsLocal-first by design. Participant video never leaves the researcher's machine, which is what makes the ethics workable.
  • 2Platial toolsA spraycan and gradient contours, for drawing boundaries that are deliberately fuzzy rather than falsely precise.

The brief

A map is very good at telling you where something is and hopeless at telling you what it is like to be there. A GPS trace records speed and elevation and nothing about the underpass that felt unsafe, the view that was worth the climb, or the traffic noise that made conversation impossible.

That gap is the whole problem for anyone studying why people walk where they walk. The qualities that decide a route are experiential, and the standard toolchain treats them as unrecordable. In practice researchers work around it by keeping a video file open in one window and a map in another, reconciling the two by hand and by memory.

WalkGIS closes that window gap. First-person video, think-aloud narration and GPS are bound to one timeline, so the question of what somebody said, where they said it, and what they were looking at is a single query rather than three separate acts of manual cross-referencing.

The insight

Two ideas do the work, and the second one is the more uncomfortable.

The first is that synchronisation is the whole product. Once video, map and transcript address the same timeline bi-directionally, the analysis changes character. Speech becomes a spatial layer, because every timestamp is also a coordinate. Asking where participants mentioned traffic stops being a read-through and becomes a map operation. That single binding is what took the analysis of one walk from two or three weeks of manual reconciliation down to about a week.

The second is that precision can be a form of dishonesty. GIS offers polygons, so qualitative spatial research draws polygons, and a crisp boundary gets placed around a perception that never had one. Nobody says they feel safe at a coordinate; they say an area feels friendly, with edges they could not point to.

The spraycan and the gradient contours exist to refuse that. Regions accumulate from overlapping translucent marks, so density carries confidence and the edge stays soft. A boundary is drawn as bands of decreasing certainty rather than a line. The output is less tidy and considerably more truthful, and it lets two participants disagree about where a place begins without one of them having to be wrong.

What it does not do

It scales to studies, not to cities. A week of analysis per walk is a large improvement on three and it is still a week, so this is a method for tens of walks rather than thousands. The volume problem is what WalkGrid went on to address from the other direction.

The fuzzy tools capture perception and do not resolve disagreement between participants. Two sprayed regions that overlap are two accounts, not a consensus, and the framework deliberately declines to average them into one. Anyone wanting a single authoritative boundary will have to make that judgement themselves.

Local-first protects participants and limits collaboration. Because nothing uploads, there is no shared workspace, no multi-coder reliability workflow, and no way for a second researcher to annotate the same walk without passing the files across. That was the right trade for footage recorded inside people’s neighbourhoods, and it is a real constraint on the method.
How it works

5 stages
  1. 01

    Record the walk from inside it

    Participants walk with a head-mounted camera, narrating what they notice as they go. The result is three streams: first-person video, think-aloud audio, and a GPS trace, each describing the same walk from a different angle.

    The video is the evidence a GPS trace cannot carry. A track shows a route; it shows nothing of the hedge, the underpass, or the view that made someone turn.

  2. 02

    Bind the media together

    Video and map are synchronised in both directions. Scrub the video timeline and the map marker moves to that position; click a point on the route and the video jumps to that moment. There is no context switch between what happened and where it happened.

    Frame-accurate synchronisation through the HTML5 media APIs, with no plugin and no server round trip.

  3. 03

    Make speech spatially queryable

    Think-aloud narration is transcribed and timestamped into the system, and because every timestamp maps to a coordinate, the transcript becomes a spatial layer. Asking where a participant mentioned traffic becomes a map query rather than a search through a document.

    Labels applied to transcript segments, such as route access, path quality or environment, carry the same spatial addressability.

  4. 04

    Draw places with soft edges

    Nobody feels safe at a coordinate. They feel that an area is friendly. A spraycan tool builds regions from overlapping translucent marks, and gradient contours express a boundary as bands of decreasing certainty rather than a single line.

    Both are deliberate refusals of the polygon. A crisp boundary drawn over a vague perception is a precision the data does not have.

  5. 05

    Keep the data on the machine

    The whole system is a standalone web application reading local GeoJSON and video files. Nothing uploads, which matters when the data is hours of footage recorded inside somebody's neighbourhood.

    Leaflet and Turf.js do all spatial analysis client-side, so distances, buffers and intersections are computed in the browser with no service dependency.

Figures

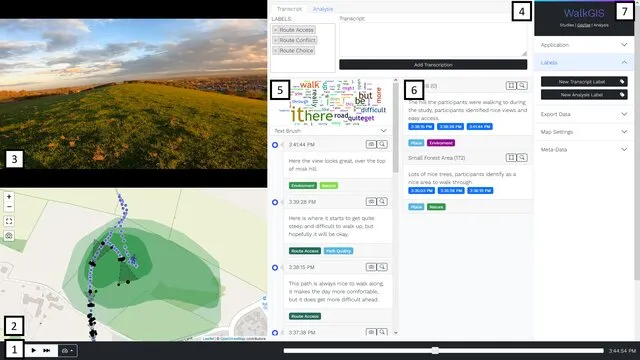
The WalkGIS interface with numbered panels showing video playback, a map with sprayed regions, transcript and analysis tabs, a word cloud, timestamped labelled transcript entries, and a settings sidebar.
Fig. 1

The full environment. Video, map, transcript, word cloud and labelling all address the same timeline, so a researcher moves between what was said, where it was said and what it looked like without leaving the view.

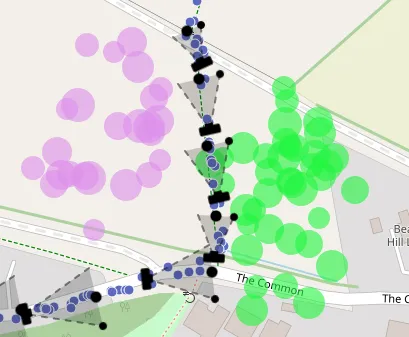
A walk trace on a map with camera view cones drawn along it and sprayed pink and green regions on either side.
Fig. 2

Camera direction along the route, with sprayed attributes either side. Knowing where the walker was looking is often more informative than knowing where they were standing.

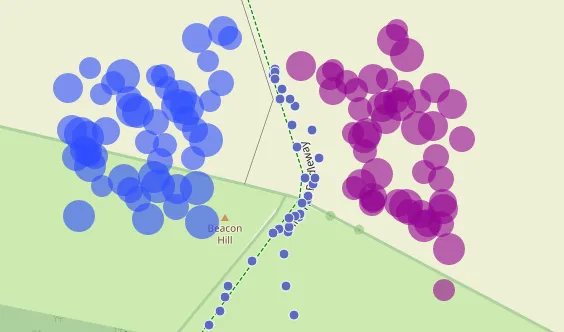
Overlapping translucent blue and magenta circles forming two soft-edged regions on a map beside a dashed walk trace.
Fig. 3

The spraycan. Regions accumulate from overlapping marks, so density carries confidence and the edge stays soft. Two participants can disagree about where a place begins and both remain legible on the same map.

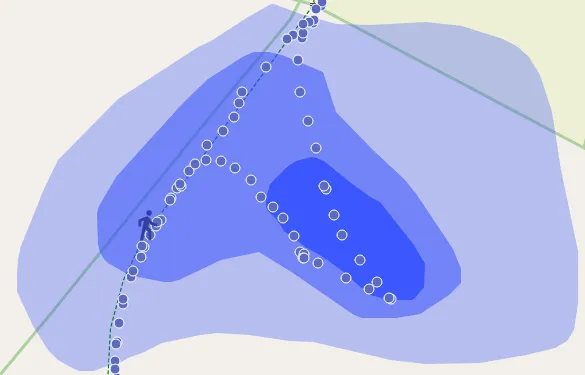
Nested translucent blue bands forming a graduated boundary around part of a walk trace.
Fig. 4

Gradient contours. The same region expressed as bands of decreasing certainty, which is closer to how somebody describes where the city centre ends than any single line would be.

Outcomes

  • Weeks of manual work became one

    Analysing a single walk previously meant two to three weeks of reconciling video, audio and track by hand. Binding the three streams to one timeline brought that to a week, largely automatically, which is what made a study of many walks feasible at all.

  • What people said became something you can map

    Timestamped transcription against a synchronised trace turns narration into a queryable spatial layer. Asking where participants talked about traffic, or where they hesitated, becomes a map operation rather than a manual read-through.

  • Vagueness got a tool instead of a workaround

    Qualitative spatial work usually forces perception into polygons because that is what GIS offers. The spraycan and gradient contours let uncertainty stay visible in the output, so the analysis inherits the ambiguity rather than discarding it.

  • Sensitive footage never left the machine

    A local-first architecture means hours of video recorded in participants' own neighbourhoods stay on the researcher's computer. That is a design decision about consent as much as about infrastructure.

Stack

Mapping
Leaflet, Turf.js, GeoJSON
Interface
JavaScript, HTML5, CSS3, Bootstrap, jQuery
Analysis
Mark.js, Select2, wordcloud2.js, Timestamped transcription
Media
HTML5 media APIs, Frame-accurate synchronisation, First-person video, Think-aloud audio
Architecture
Local-first, Client-side spatial analysis, No server dependency, Standalone web application

Partners

Project team

  • Dr James PinchinUniversity of Nottingham
  • Dr Adrian HazzardUniversity of Nottingham
  • Prof Gary PriestnallUniversity of Nottingham
  • Dr Stefano CavazziOrdnance Survey
  • Dr Andrea BallatoreKing's College London
  • Engineering and Physical Sciences Research Council
  • Ordnance Survey
  • Horizon Centre for Doctoral Training
  • University of Nottingham

This work was supported by the Engineering and Physical Sciences Research Council [grant number EP/S023305/1] and by Ordnance Survey.

Work like this

Start a
conversation →

Available for consulting engagements and research collaborations at this scale. Email james@jameswil.com.