Project

PARM-X: projecting live geospatial data onto physical city models

The interactive software layer for Nottingham's projection augmented relief model. Live council data, crowd simulations and public responses draped onto physical terrain across four synchronised screens, cutting a four-hour preparation process to minutes for executive planning sessions.

Period

2025 to 2026

Status

Active

Role

Lead developer

Areas

React · TypeScript · Leaflet · Esri · H3 · Three.js · Supabase · PostGIS

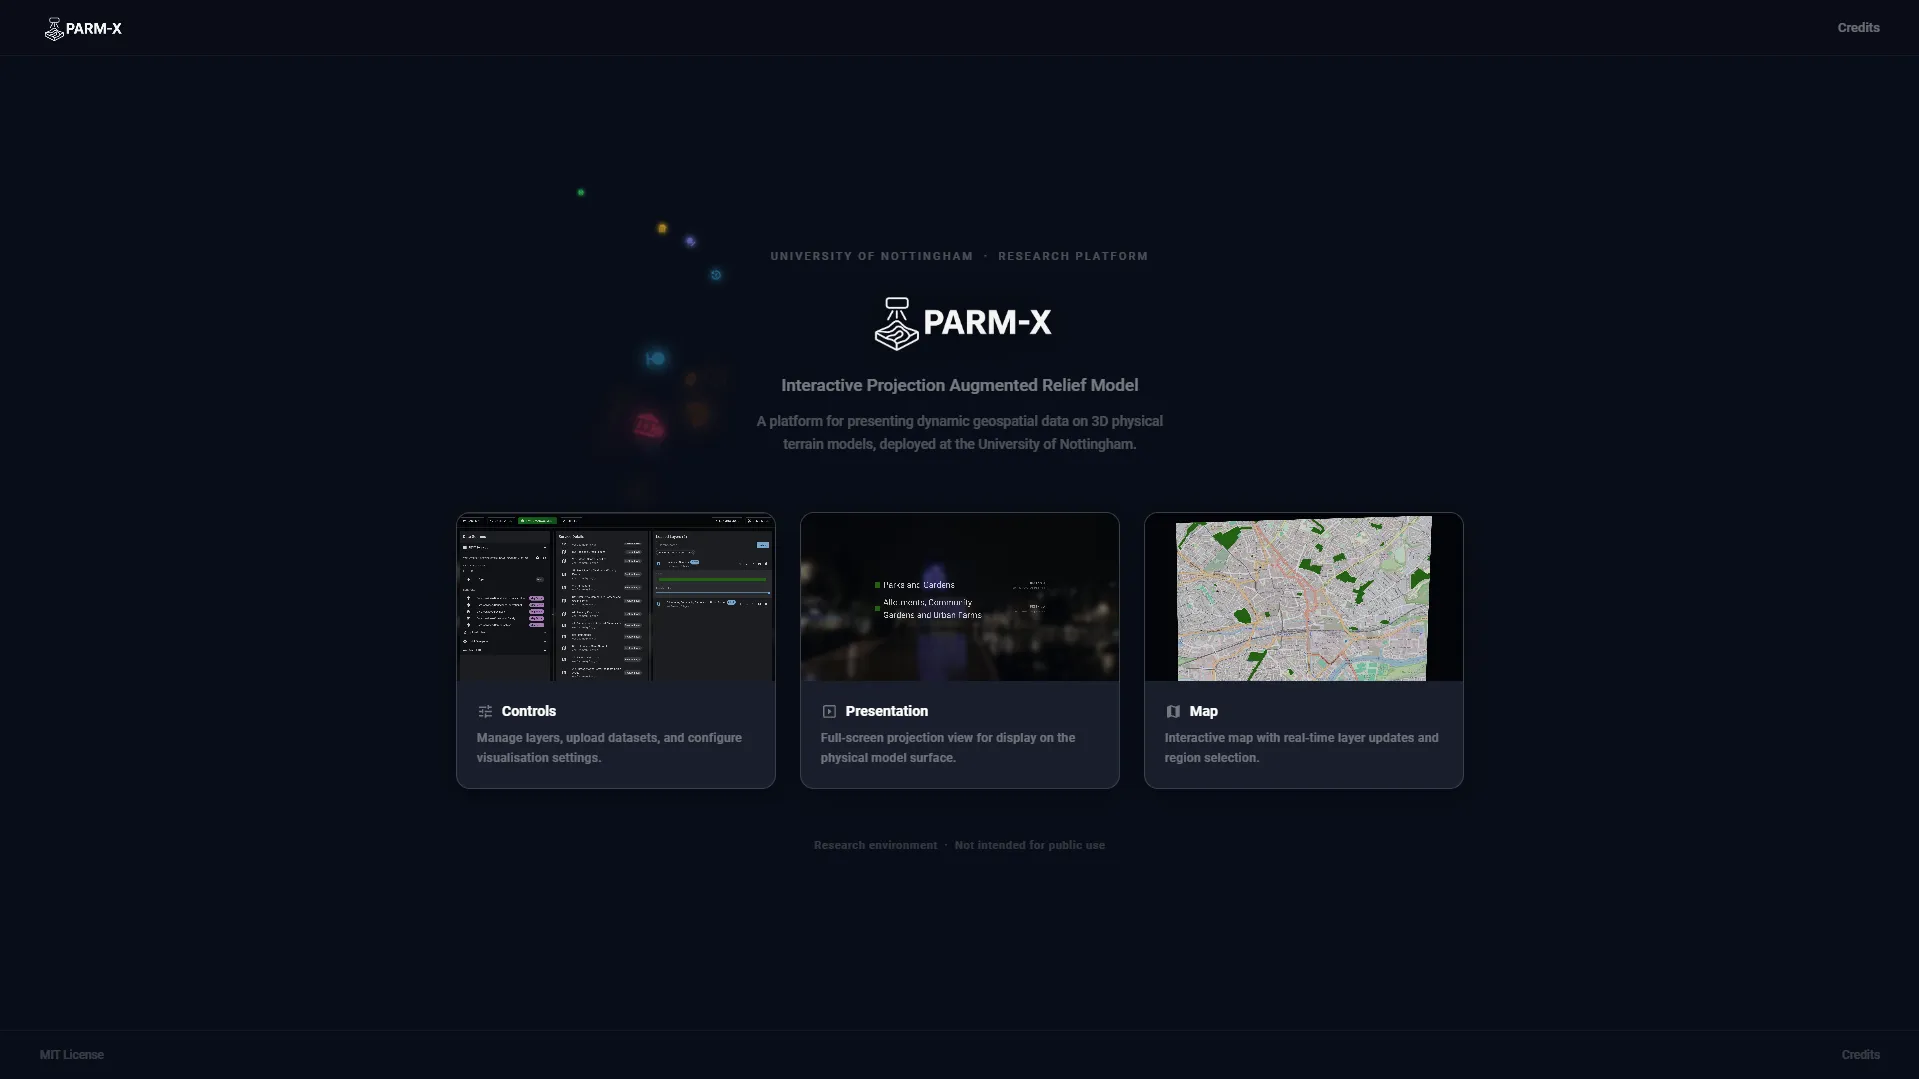
The PARM-X landing page, a Three.js particle scene introducing the Controls, Presentation and Map interfaces.
Figure

The landing page. A Three.js particle scene introducing the three core interfaces that run as independent, synchronised browser windows.

  • 4h → minMap preparationA four-hour manual process reduced to minutes, producing cartographic outputs and live 3D displays for executive planning sessions.
  • 5Data pipelinesArcGIS REST, file upload, OSM Overpass, WMS and authenticated ArcGIS Online, all loading into one unified layer list.
  • 4Screen routesControls, Map Display, Presentation and a mobile participant view, kept in sync with no server-side relay.
  • MITOpen sourceBuilt entirely on open components and open standards, and reconfigurable to any city by changing the bounds constants.

The brief

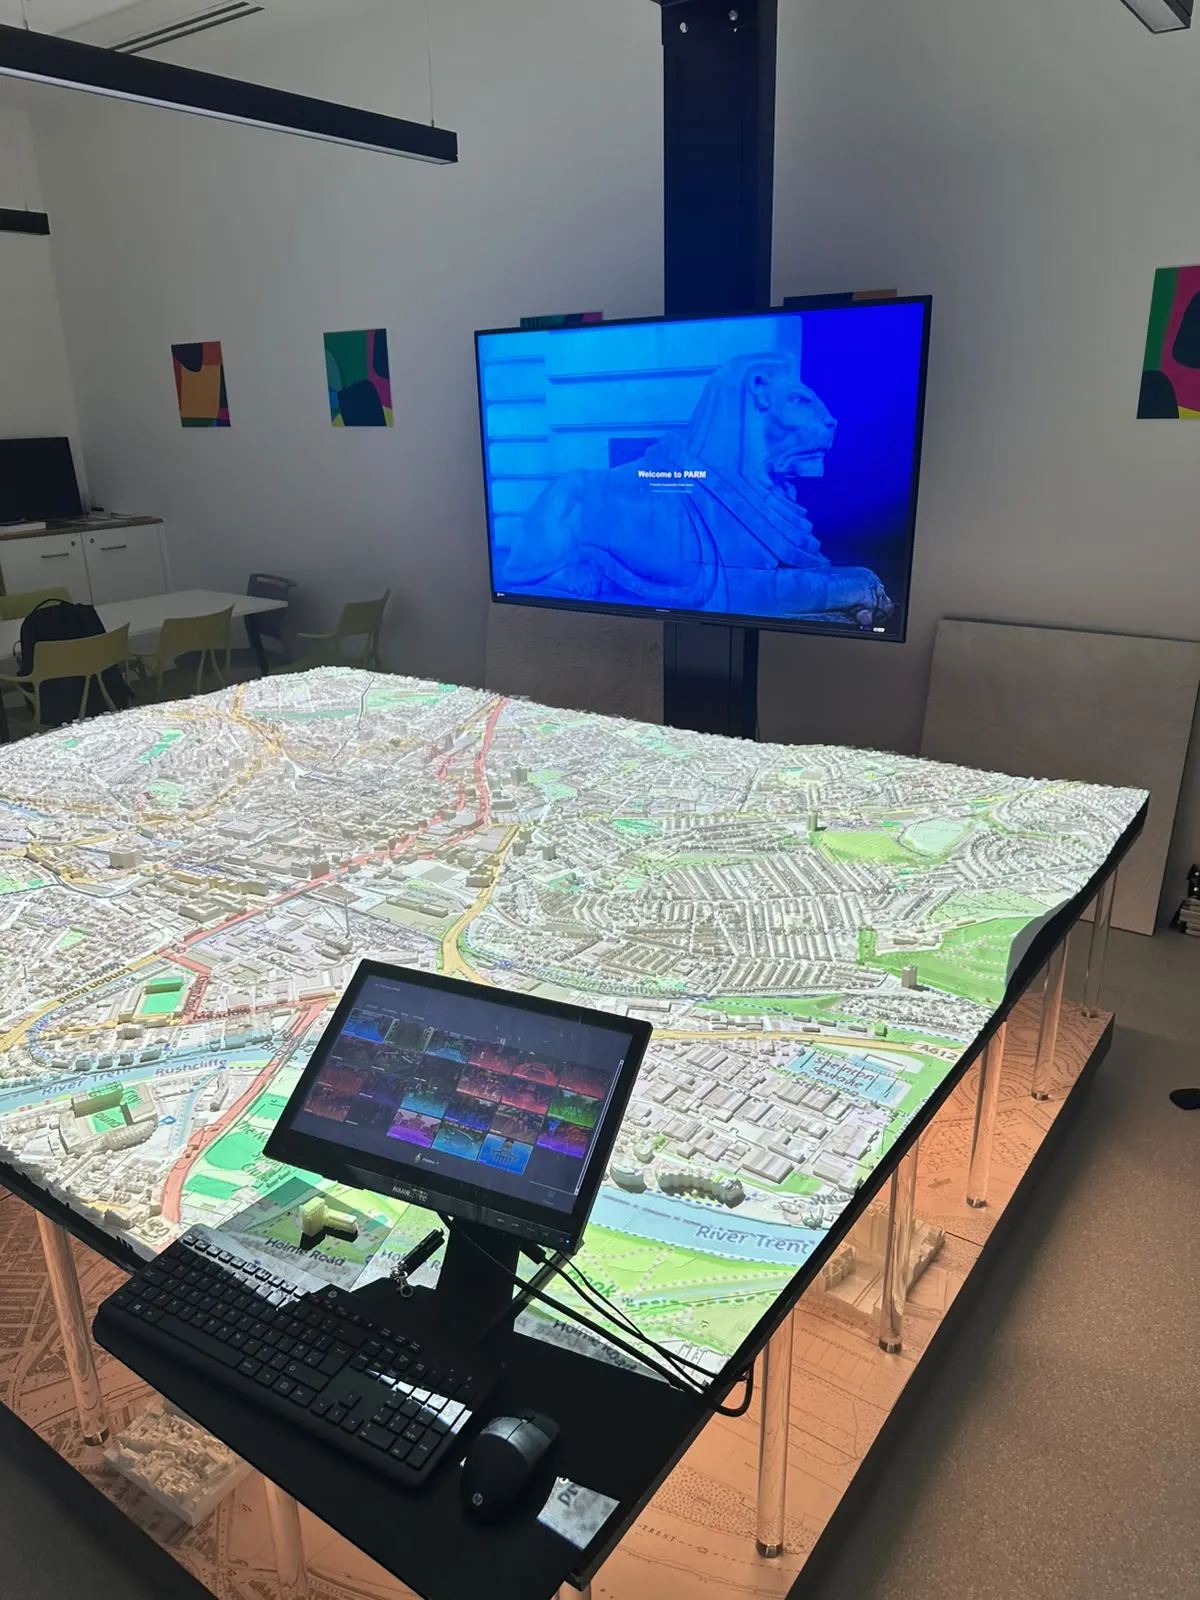
A physical relief model of a city is one of the best public engagement tools there is. People who will not read a planning document will lean over a model of their own street and point at it. The problem is that a model says exactly one thing forever. It is built, and then it is finished.

Projection is the obvious escape, and it usually fails on the boring details. The projector cannot always be hung directly overhead, so the image arrives skewed. Getting new data onto the surface means preparing it in advance, so a session cannot follow the question a room is actually asking. And the audience stays an audience, because there is no route from looking at the model to putting something on it.

PARM-X is the software that fixes those three. Nottingham’s model and the City as Lab programme around it were already running. What was missing was a way to drive the projection live from a browser, so a model can show anything the city publishes, from any projector angle, while the people standing around it add to what is on it.

The audience turned out to matter as much as the mechanism. The same platform runs a public session in a library and an executive planning session, and in the second case the four hours that used to go into preparing cartographic outputs for a meeting now go into the meeting itself.

The insight

The architectural decision that made the rest tractable was to treat the installation as three independent browser windows rather than one application driving multiple displays. The operator console, the projected map and the public screen each run standalone and stay in step over BroadcastChannel.

That sounds like a small thing and it removes an entire class of problem. There is no server to deploy, no socket connection to drop halfway through a session in a building with awkward wifi, and no privileged display process to crash and take the others with it. A window can be closed and reopened mid-session and it rejoins the current state. For an installation that has to survive being run by someone who did not build it, in a room nobody tested in, that resilience matters more than elegance.

The second decision was to solve calibration properly. A scale-and-offset transform is quick and only works from directly overhead. Solving a full homography from four clicked corners means the projector can sit wherever the room allows, which is what determines whether the system can be installed somewhere that was not designed for it.

What it does not do

Calibration state lives in the session store, so a fresh browser session needs recalibrating. That is a deliberate trade for the moment, since a saved calibration that silently no longer matches the projector position is worse than one you know you have to redo, but it is friction at the start of every session.

Agent simulation is illustrative rather than predictive. Agents follow a road network and a set of origin and destination presets, and the flows are plausible, but there is no calibrated behavioural model underneath and the output should not be read as a forecast.

The platform is configured for one city. Retargeting is a matter of bounds constants and endpoints rather than architecture, but the scenario presets, the landmark sets and the curated media library are all specific to Nottingham and would need rebuilding.
How it works

5 stages
  1. 01

    Run three windows as one application

    The operator console, the projected map and the public presentation screen are independent browser windows served from the same origin. A single Zustand store serialises application state and broadcasts changes over named BroadcastChannel instances, so a layer toggled on the console appears on the model within milliseconds.

    Separate channels isolate concerns: parm-video for overlays, music_sync_channel for audio, parm-games for game state, parm-screenshot for exports. No websocket server, no backend relay, no deployment dependency.

  2. 02

    Calibrate the projection onto a physical surface

    Aligning a digital map to a physical model is a genuine geometric problem, because the projector is rarely mounted directly overhead. The operator clicks the four corners of the model on the map screen and the system solves a homography, applying it to the map viewport as a CSS matrix3d transform.

    A bespoke Gaussian elimination solver computes the perspective transform. The map is then refitted to exact geographic bounds so tiles, vector overlays and drawn shapes all land in the right physical place.

  3. 03

    Load anything the council already publishes

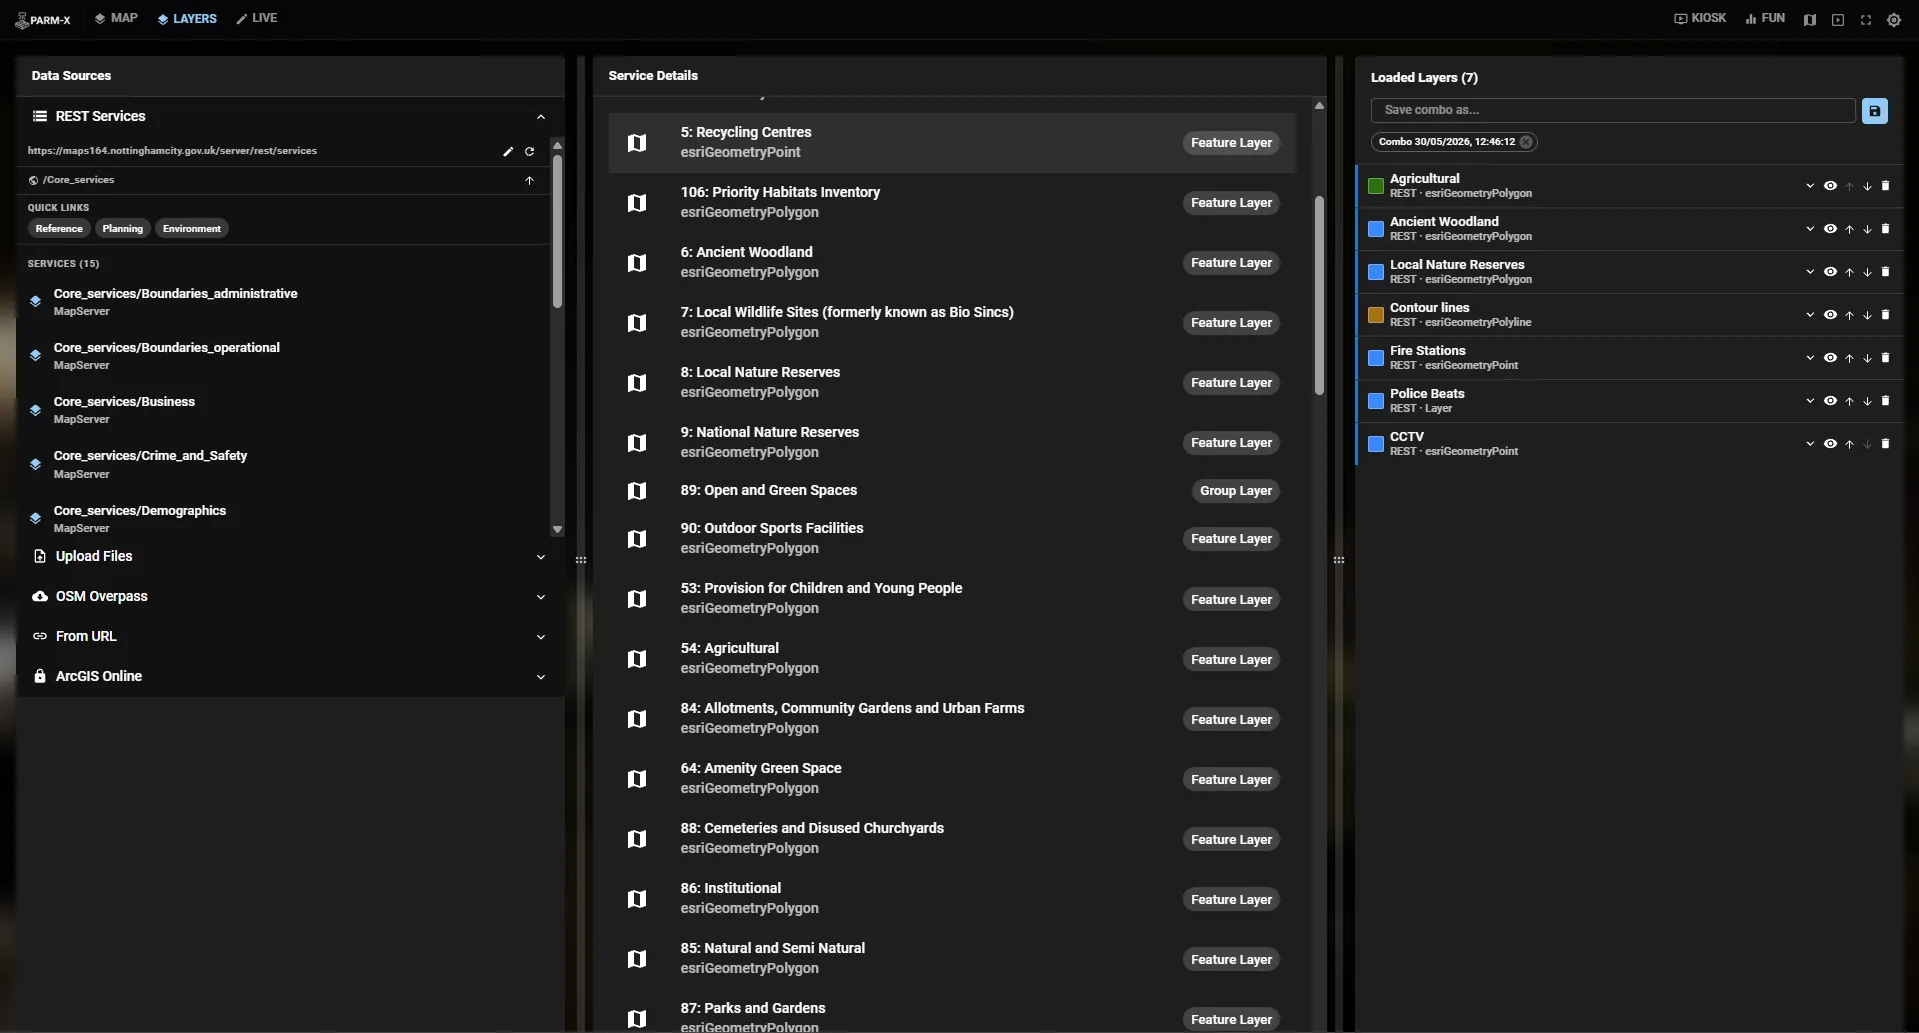
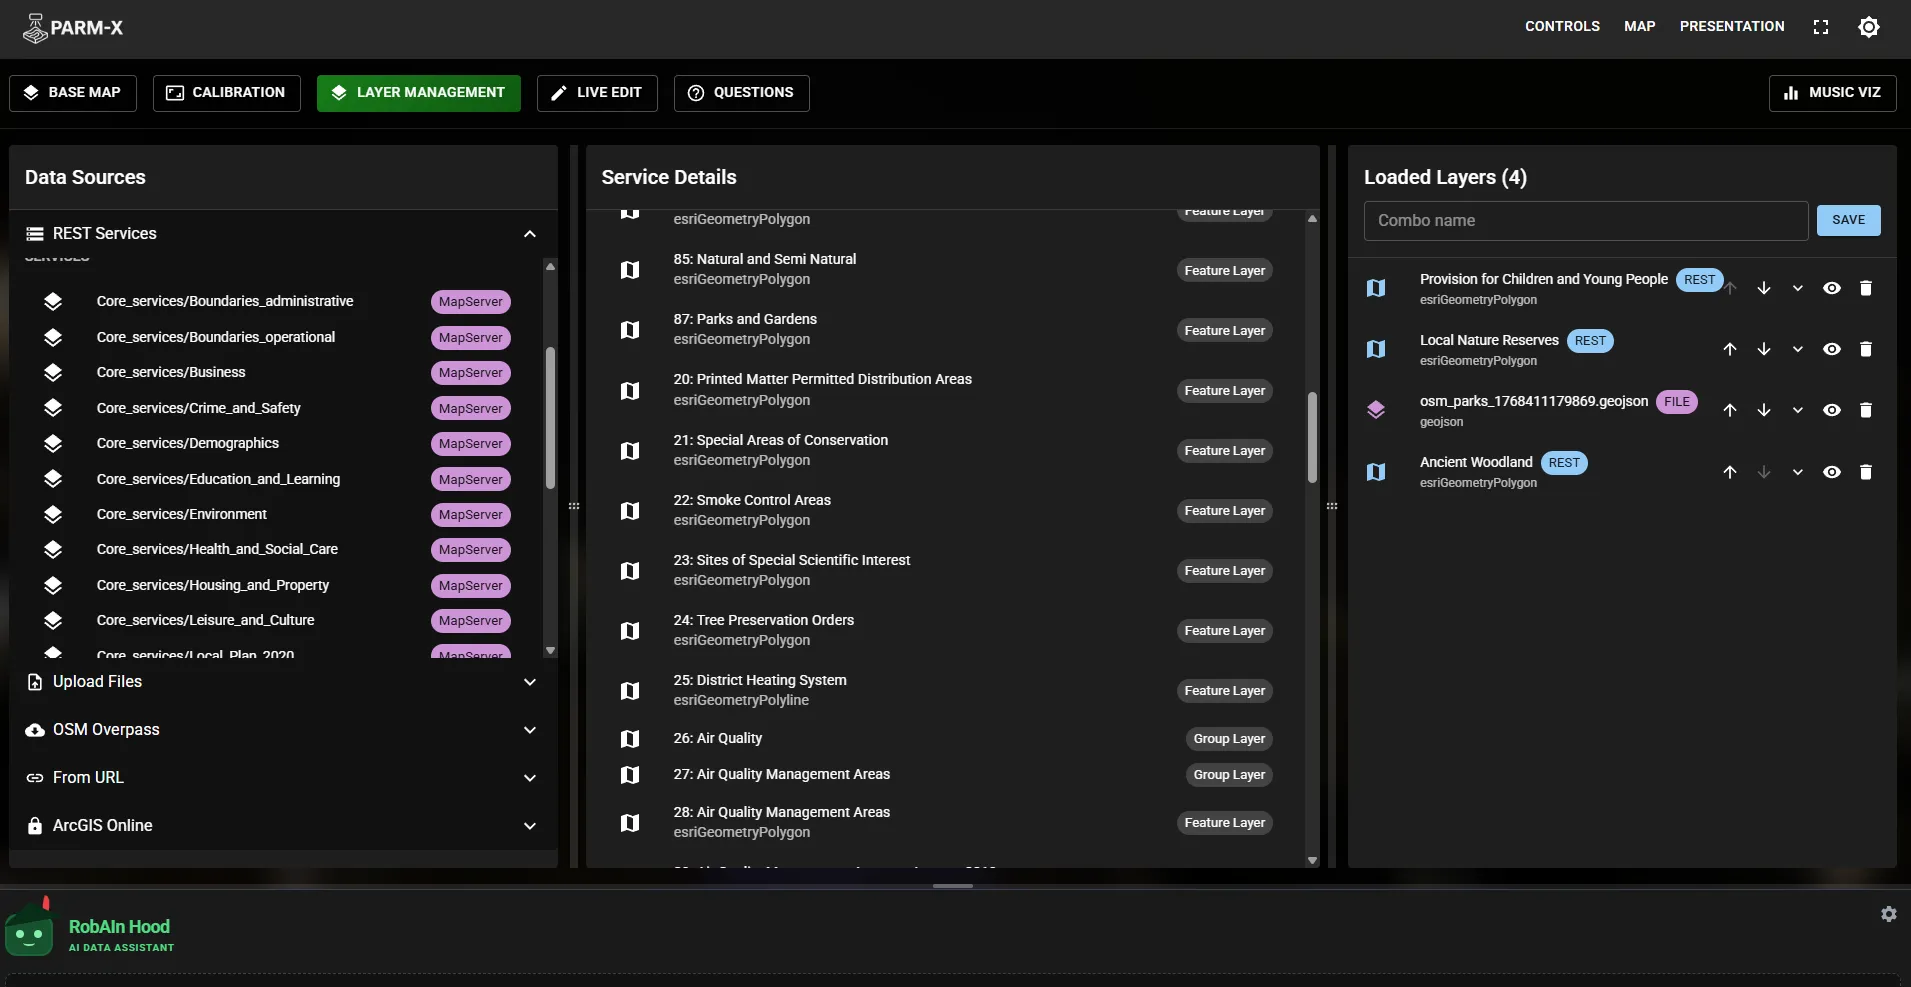
    Five pipelines feed one layer list. The ArcGIS REST browser walks Nottingham City Council's service tree and parses styling straight from each service's drawingInfo renderer. Shapefiles, GeoJSON and CSV are parsed client-side, Overpass queries are run live, and a serverless function proxies authenticated ArcGIS Online portals so credentials never reach the browser.

    CSV parsing handles quoted fields and the usual column name variants. Derived layers, including heatmap, Voronoi, H3 grid, Turf hexgrid and clusters, are computed on demand from any point dataset.

  4. 04

    Simulate movement across the model

    A pedestrian agent engine loads Nottingham's road network live from Overpass and moves agents between landmarks, transport hubs, stadiums and neighbourhoods. Presets model real scenarios: matchday arrival and dispersal for Forest and County, commuter peaks, the Robin Hood Marathon, Hockley's night economy.

    Road type filters restrict movement to chosen highway categories, so trunk-road traffic and footway wandering can be modelled separately on the same network.

  5. 05

    Collect responses from the people in the room

    Participants scan one QR code and reach a mobile-first interface offering drawing, polls, free text and sliders. Projects can be sequenced into a multi-step survey that advances automatically. Contributions land in Supabase and appear on the projected surface immediately.

    Spray drawing upserts into a single record per user rather than inserting a row per stroke, cutting write volume while preserving spatial fidelity. PostGIS-compatible payloads, Row Level Security, live updates over Supabase Realtime.

Figures

The PARM-X Controls interface showing the data sources panel, an ArcGIS REST service browser, and the active layer list with styling controls.
Fig. 1

The operator console. Data sources on the left, the ArcGIS REST service browser in the centre, and the active layer list with per-layer visibility, z-index, opacity, colour and filter controls on the right. Everything here is mirrored onto the projected map as it changes.

The ArcGIS REST layer browser navigating Nottingham City Council service folders and feature layers.
Fig. 2

Navigating the council's published service directory. Styling is read directly from each service's renderer definition, so a layer arrives on the model looking the way its publisher intended rather than as undifferentiated default geometry.

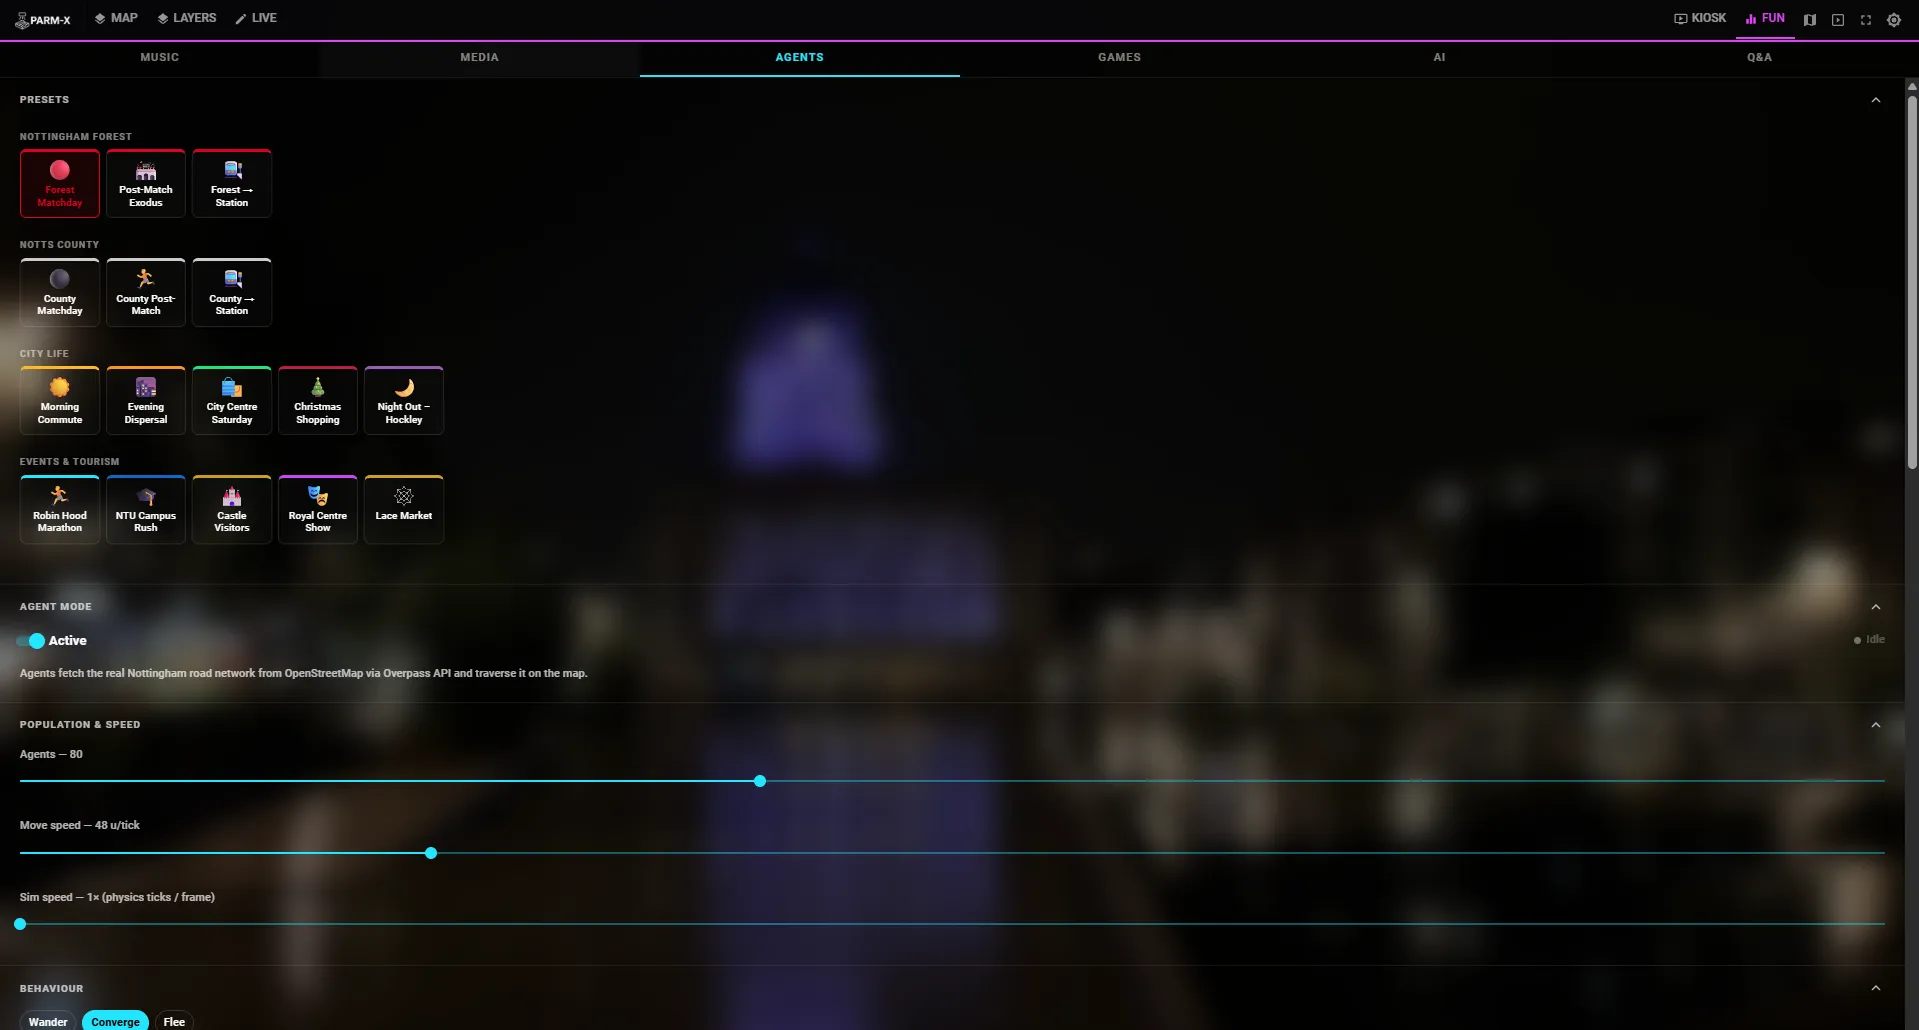
The agent simulation panel showing preset scenarios, agent configuration and road network controls.
Fig. 3

The agent simulation panel. Preset scenarios cover matchdays, the marathon, commuter peaks and Christmas shopping, with road type filters and speed controls over a network loaded live from Overpass.

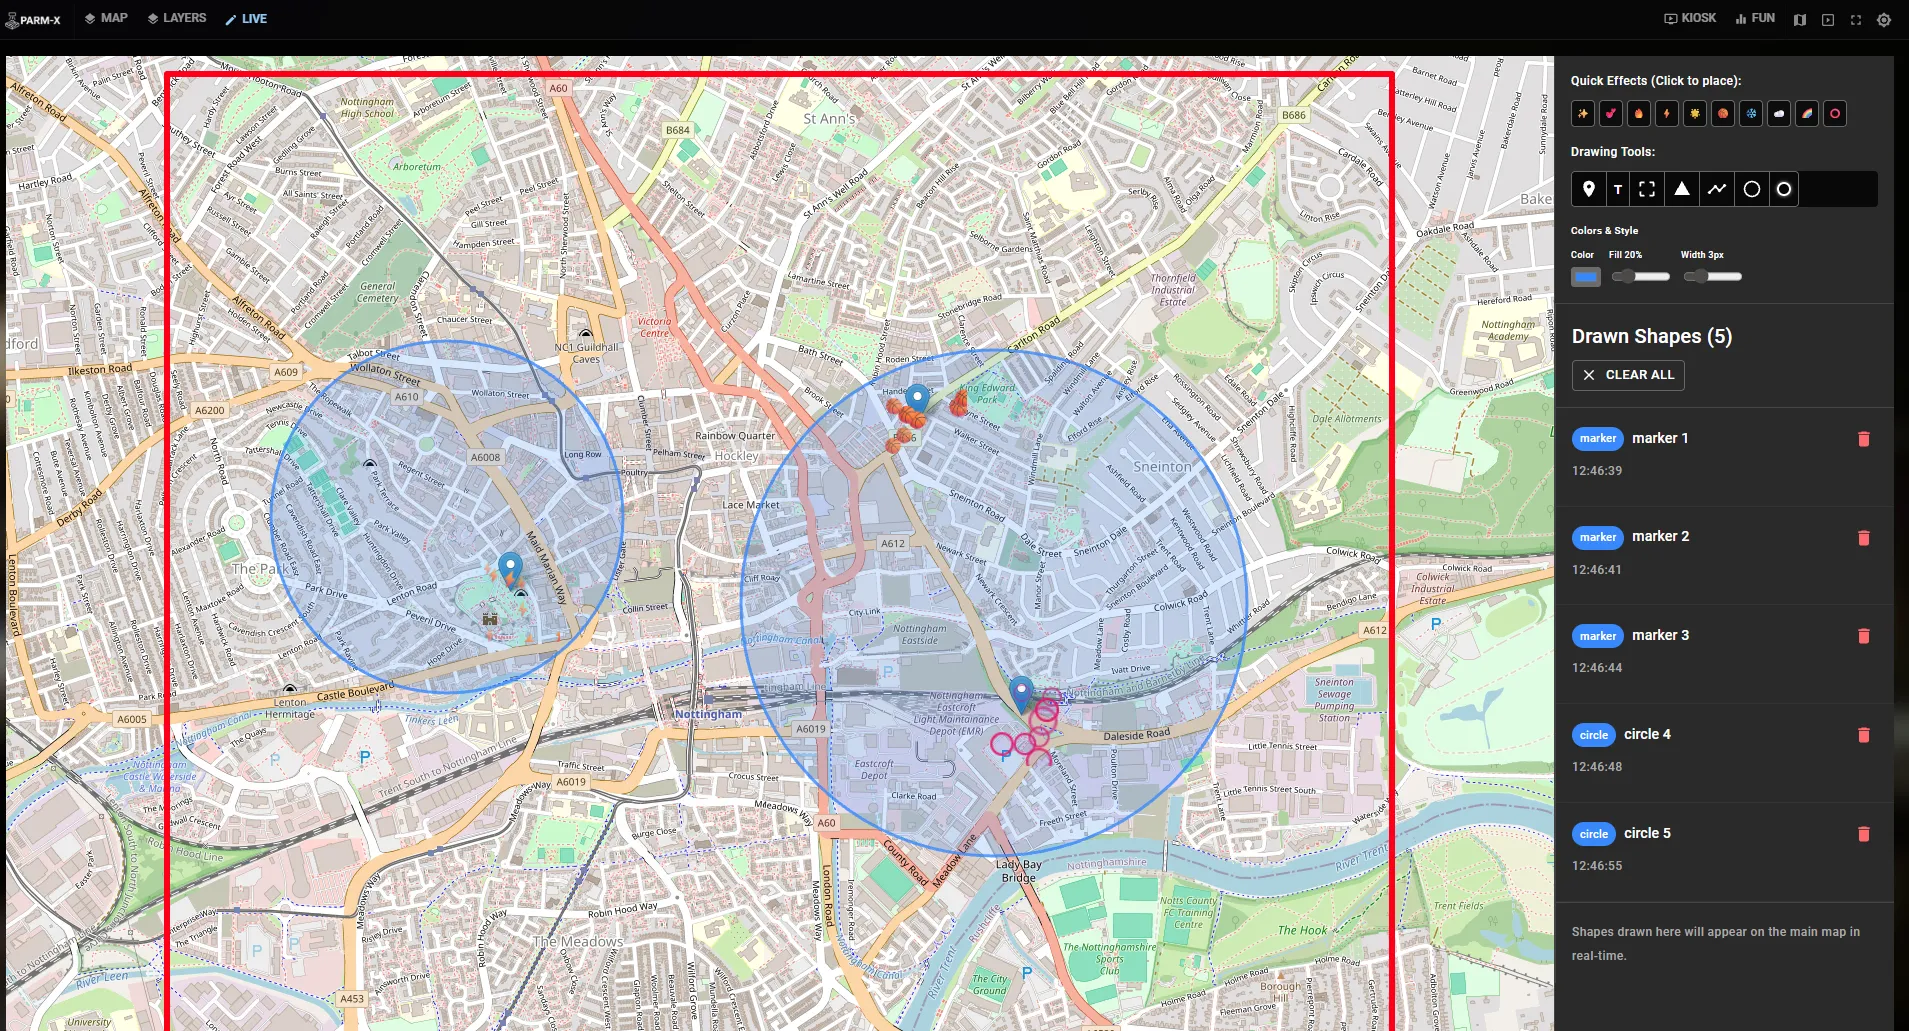
The live drawing panel showing shapes drawn over Nottingham city centre with per-shape effect controls.
Fig. 4

Live annotation during a session. Markers, lines, polygons and text are drawn on a bounded secondary map and replicated to the projection, with per-shape animation effects applied as CSS classes to the Leaflet SVG at runtime.

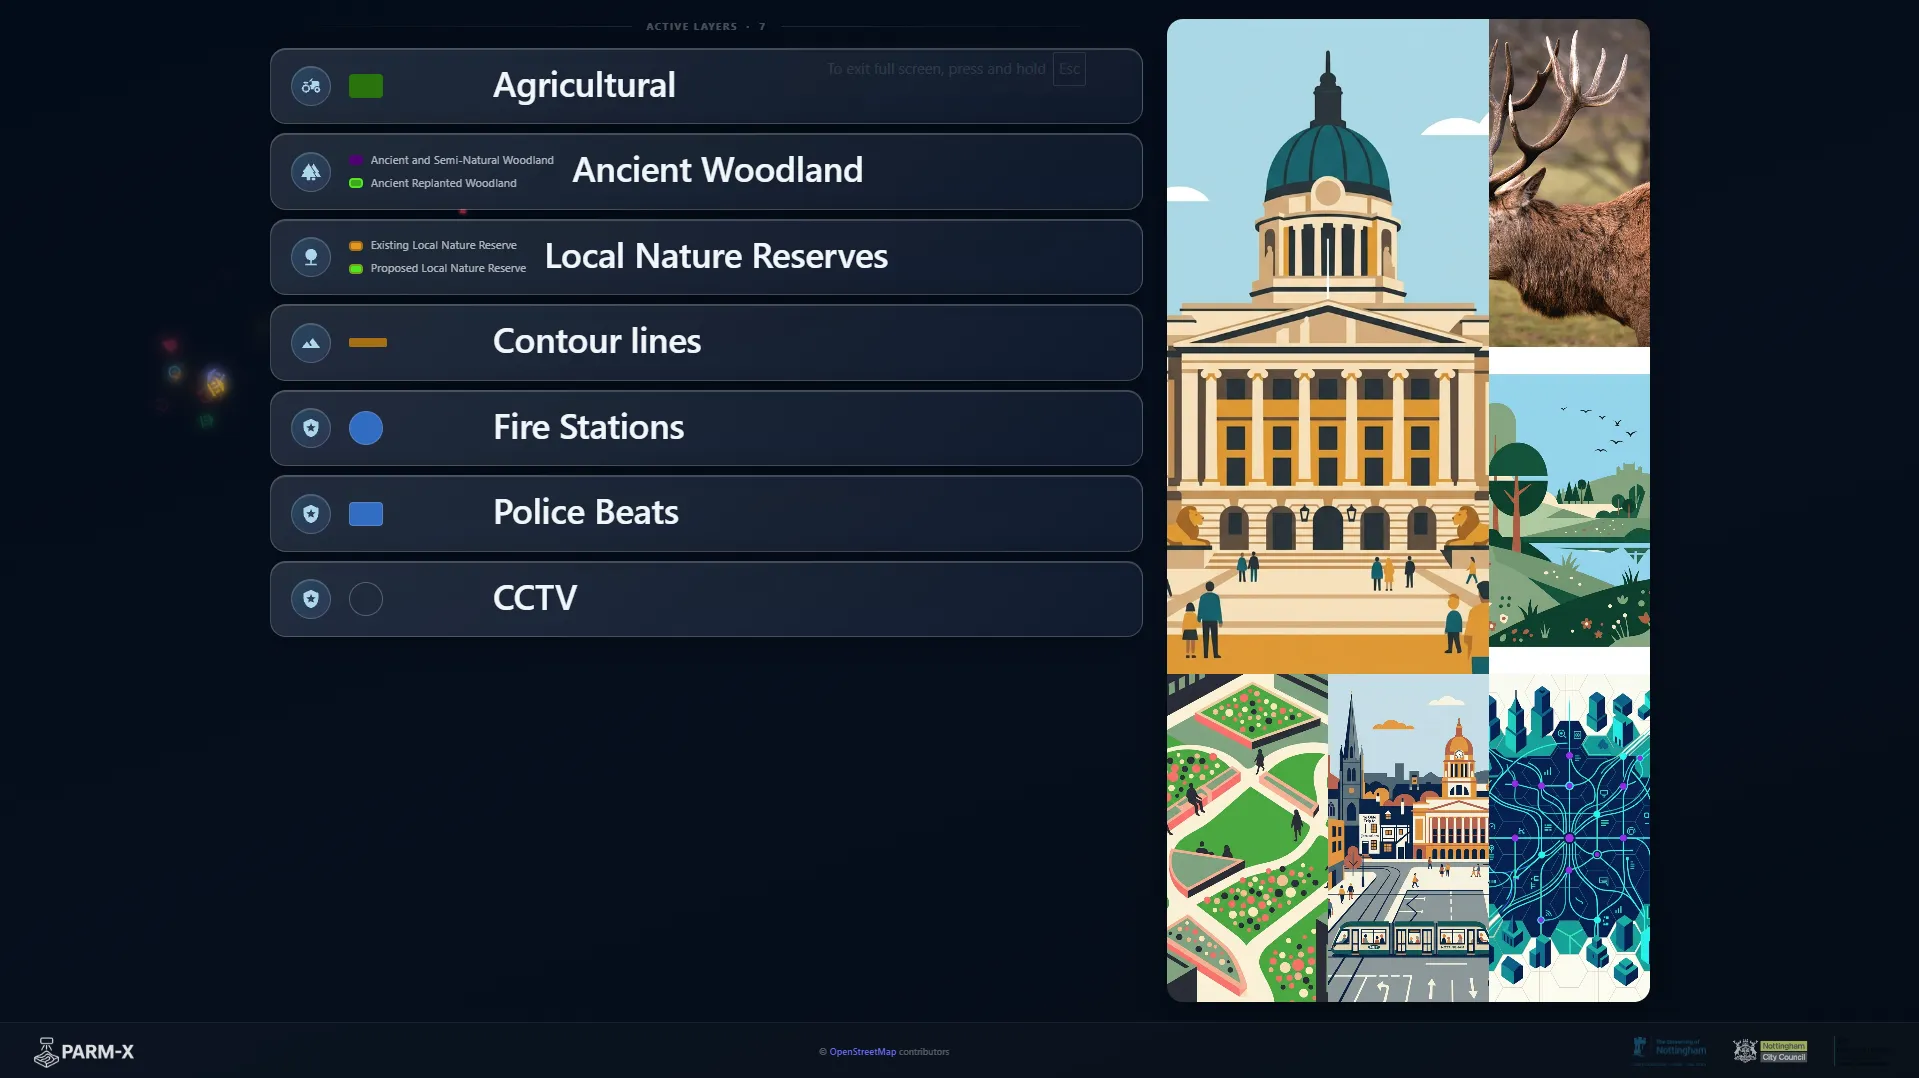
The PARM-X Presentation screen showing the active layer list with source types alongside Nottingham imagery.
Fig. 5

The public-facing screen. Active layers are listed with source type and styling summary, and where a research project is running a QR code appears here, which is the entire onboarding path for a participant.

Outcomes

  • Live control of what the model shows

    Datasets change while a session is running rather than being prepared in advance. An operator toggles a layer on the console and it lands on the physical terrain within milliseconds, which is what lets a session follow the question a room is actually asking.

  • A four-hour job became a four-minute one

    Producing cartographic outputs and live 3D decision-support displays for executive planning sessions previously meant hours of manual preparation per session. Driving the projection from live services collapsed that to minutes, which is the difference between preparing for a meeting and responding during one.

  • Off-axis projection handled properly

    Calibration solves a full perspective homography from four clicked corners rather than a simple scale and offset, so the projector does not have to hang directly above the model. That is what lets a setup go into a room that was not designed for it.

  • Three windows, no server

    Running the console, the projection and the public screen as independent windows synchronised over BroadcastChannel means there is no relay to deploy and no socket to drop mid-session. A window can be closed and reopened and it rejoins the current state, which matters for something run by people who did not build it.

  • A route from watching to contributing

    Visitors mark locations, vote or work through a spatial survey from their own phone via a QR code, and their responses appear on the projected surface in front of them. This is the part now going into the library engagement work.

  • Portable by design

    The platform runs entirely on open-source components and open standards, including GeoJSON, Shapefile, OGC WMS, ArcGIS REST and OSM Overpass. Retargeting it to another city is a matter of changing the bounds constants and the default endpoint.

Stack

Application
TypeScript, React, Vite, MUI, Zustand
Mapping
Leaflet, Esri Leaflet, Turf.js, H3-js, shpjs, Leaflet.heat
Graphics
Three.js, Web Audio API, CSS matrix3d homography, canvas overlays
Data
Supabase, PostgreSQL, PostGIS, Row Level Security, Supabase Realtime
Sources
ArcGIS REST, ArcGIS Online, OSM Overpass, OGC WMS, GeoJSON, CSV, Shapefile
Platform
Vercel, serverless token proxy, BroadcastChannel API, Web Speech Recognition

Partners

Project team

  • Dr Gary PriestnallUniversity of Nottingham
  • Mick DunnNottingham City Council
  • University of Nottingham
  • Nottingham City Council
  • Ministry of Housing, Communities and Local Government

This project received funding from the Ministry of Housing, Communities and Local Government (PropTech 4 programme).

Work like this

Start a
conversation →

Available for consulting engagements and research collaborations at this scale. Email james@jameswil.com.