Project

CDISAW: a queryable data infrastructure for slavery and armed conflict

A research platform that makes 53 incompatible datasets on slavery in war answerable as one corpus. 23.5M linked event records across five ontological layers, queried through a typology-first interface, with every query citable.

Period

2026 to present

Status

Active

Role

Lead developer

Areas

PostGIS · FastAPI · Elasticsearch · H3 · Docker · Ontology · Open data

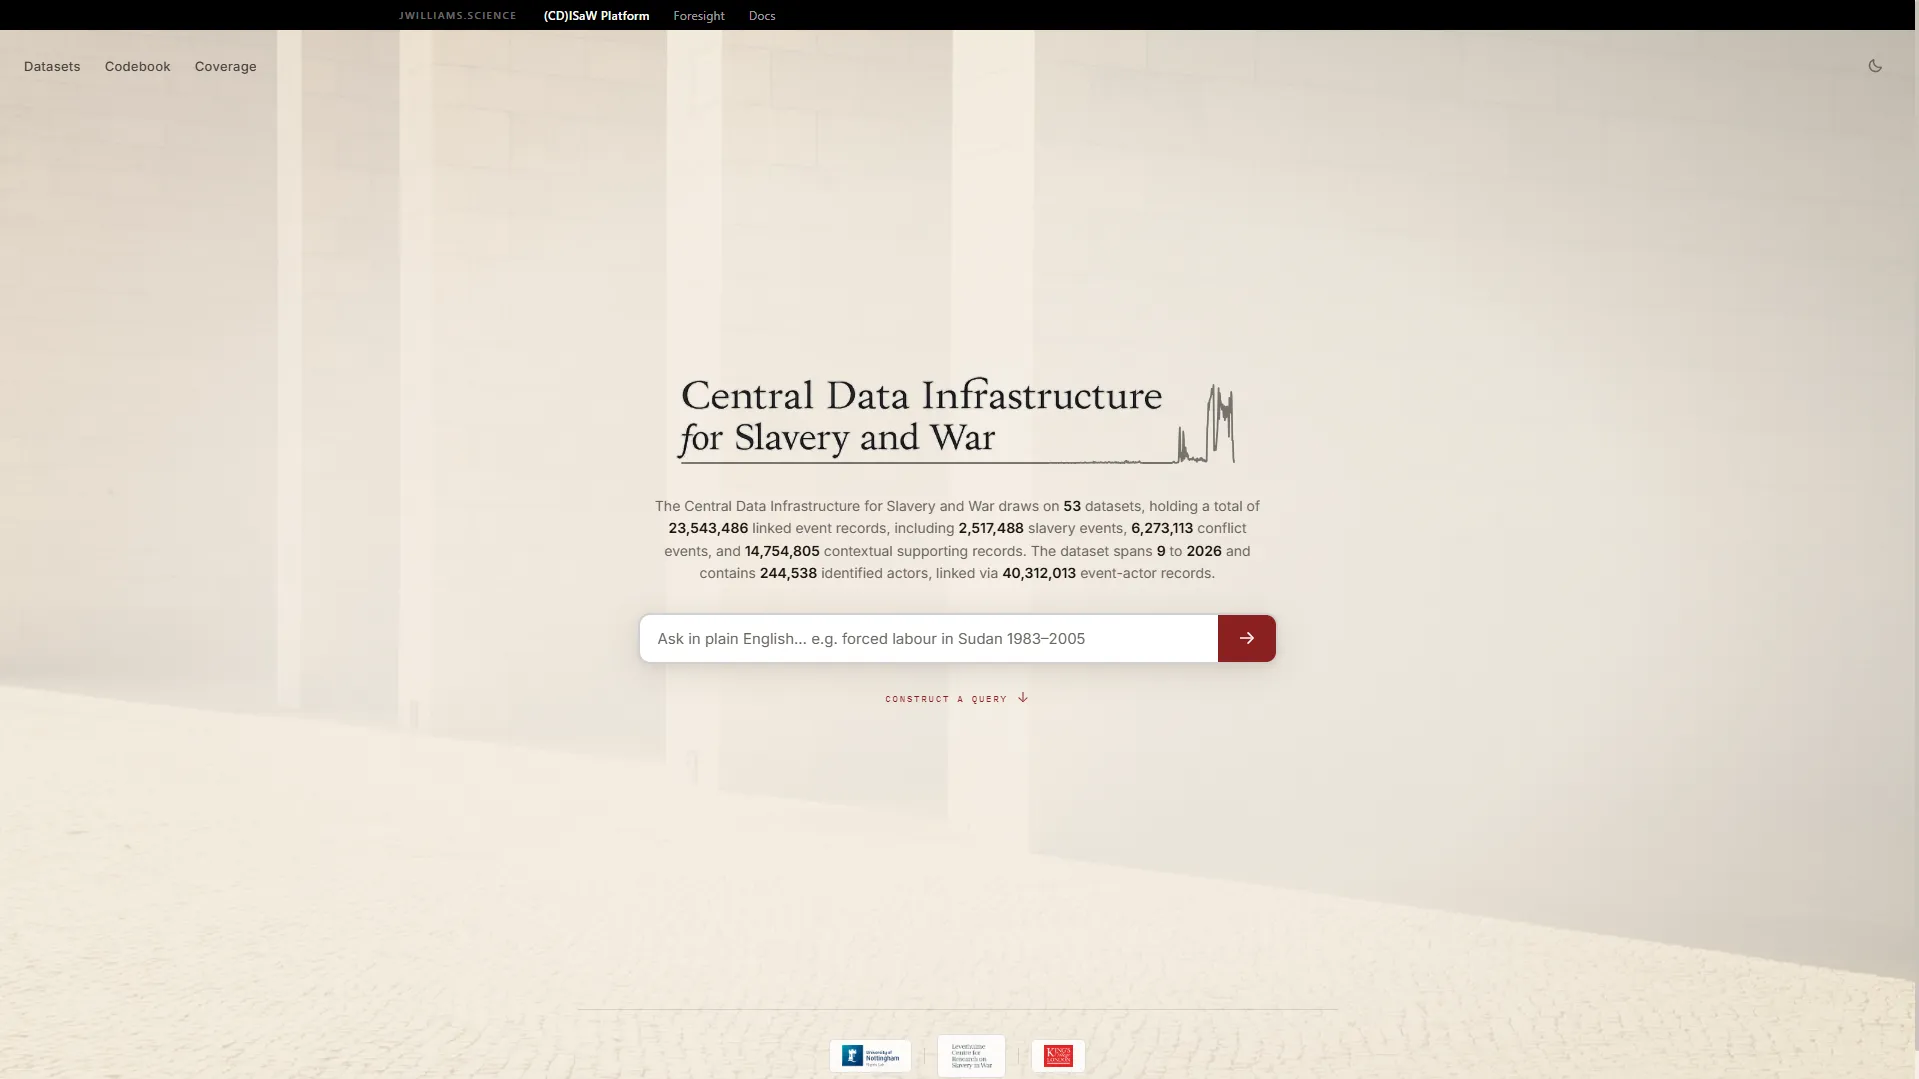
The CDISAW landing page, showing the platform title over pale stone architecture with live record counts and a plain-English query box.
Figure

The platform reports its own scale on arrival, and takes a question in plain English. The counts below the title are live, not a claim in a README.

  • 23.5MLinked event records2,517,488 slavery events, 6,273,113 conflict events and 14,754,805 contextual supporting records, held as one queryable corpus.
  • 53Datasets unifiedREST APIs, CSV exports, GeoJSON, SQLite archives, shapefiles, WFS and SPARQL endpoints, normalised onto a single schema.
  • 244,538Identified actorsIndividuals, armed groups, states and organisations, tied to events through 40,312,013 event-actor records.
  • 110Typology cellsTen slavery typologies against eleven conflict contexts. This grid is the entry point to every query in the system.

The brief

The study of slavery in war draws on armed conflict databases, humanitarian datasets, tribunal records, archival sources and qualitative case studies. ACLED and UCDP publish REST APIs. The ILO publishes surveys. ICTY case records sit in tribunal archives. Wikidata answers SPARQL. They differ in format, temporal resolution, geographic reference frame and disciplinary vocabulary.

That heterogeneity is not an accident to be tidied away. It reflects a genuinely multi-disciplinary field, and each source is shaped correctly for the community that produced it. The cost lands on anyone trying to work across them. A researcher comparing patterns of forced labour across civil wars has to assemble and reconcile sources that were never designed to be used together, and has to do it again from scratch for the next question.

CDISAW is not another dataset. It is the layer that makes the existing ones answerable together, holding 23.5 million linked event records drawn from 53 sources behind one query interface and one shared ontology.

The insight

The organising decision was to make classification the entry point rather than a filter applied at the end.

Most spatial and temporal platforms start from where and when, then let you narrow by category. Here it runs the other way. A researcher first selects cells from a 10 by 11 grid of slavery typology against conflict context, and only then constrains time, place and actor. That ordering is a claim about the field: the research question in this domain is the intersection of a kind of slavery with a kind of conflict, and everything else qualifies it.

Building the interface around that claim has a practical payoff. Because the typology is explicit and shared, two researchers asking about forced labour in occupation contexts are demonstrably asking the same question, even when their underlying sources differ completely.

The second decision was to treat a query as a citable object. Serialising the full query state to a persistent CDQ code means a paper can reference the operation that produced its result, not merely the datasets it drew on. That is a small piece of infrastructure addressing a real gap, since a reader can currently check your sources but not your question.

What it does not do

It does not resolve contested classification. Assigning a dataset to cells in the matrix is an interpretive act, and reasonable scholars will disagree about whether a given case is forced marriage or sexual slavery, or whether a conflict counts as civil war or insurgency. The platform makes those assignments explicit and inspectable, which is better than burying them, and it does not make them correct.

It inherits every bias in its sources. Historical atrocity data is recorded unevenly, and the unevenness is not random: better-documented theatres produce more records, and an absence of events in a region is far more likely to mean an absence of recording than an absence of slavery. Counts from this platform describe the evidence base, not the past.

Place-name disambiguation across centuries remains unsolved, actor timelines and a GraphQL endpoint are planned rather than built, and scheduled synchronisation against ACLED and UCDP is not yet running. The Bosnia pilot will be the first full-scale demonstration that the cross-layer query design holds up against a real research programme.
How it works

5 stages
  1. 01

    Classify before anything else

    Every dataset is placed on a 10 by 11 grid of slavery typology against conflict context, from chattel slavery and debt bondage through to forced marriage and sexual slavery, set against interstate war, civil war, occupation, genocide and post-conflict. A dataset can occupy many cells at once.

    This matrix is the entry point to every query. A researcher states the intersection they care about before touching a date, a place or an actor.

  2. 02

    Normalise onto five layers

    Classification, temporal, spatial, actors and conflict events. The split is an argument about how this evidence is constituted rather than a convenient table design, and it is what lets sources built for different disciplines be compared at all.

    Temporal precision is stored with a flag, so a year-level record and a day-level record can coexist without one pretending to the other's accuracy. Raw source fields are preserved in JSONB alongside the normalised columns.

  3. 03

    Index space with H3 and PostGIS

    Events carry an H3 index at resolutions 0 to 15 alongside PostGIS point geometry, so lookup works by hexagon, by coordinate, or by ISO administrative code, and bounding-box filtering runs through ST_Within.

    Hexagons give uniform area and hierarchical aggregation, which matters when comparing a densely recorded European theatre against a sparsely recorded one.

  4. 04

    Register sources declaratively

    A dataset is added by writing a connector configuration, not by writing ingestion code. Seven connector types cover REST, CSV, GeoJSON, SQLite, shapefile, WFS and SPARQL, each carrying a field map and a declaration of how source fields distribute across the five layers.

    Describing a source is separated from fetching it, so datasets can be catalogued before they are ingested and resynchronised on a schedule afterwards.

  5. 05

    Make the query itself citable

    Saving a query serialises its full state, meaning typology selections, date range, geographic extent and output format, and returns a persistent code in the form CDQ-YYYYMMDD-XXXXX. That code can be shared as a URL, cited in a paper, or restored in one click.

    Dataset citation tells a reader what you looked at. It does not tell them what you asked. CDQ codes close that gap.

Figures

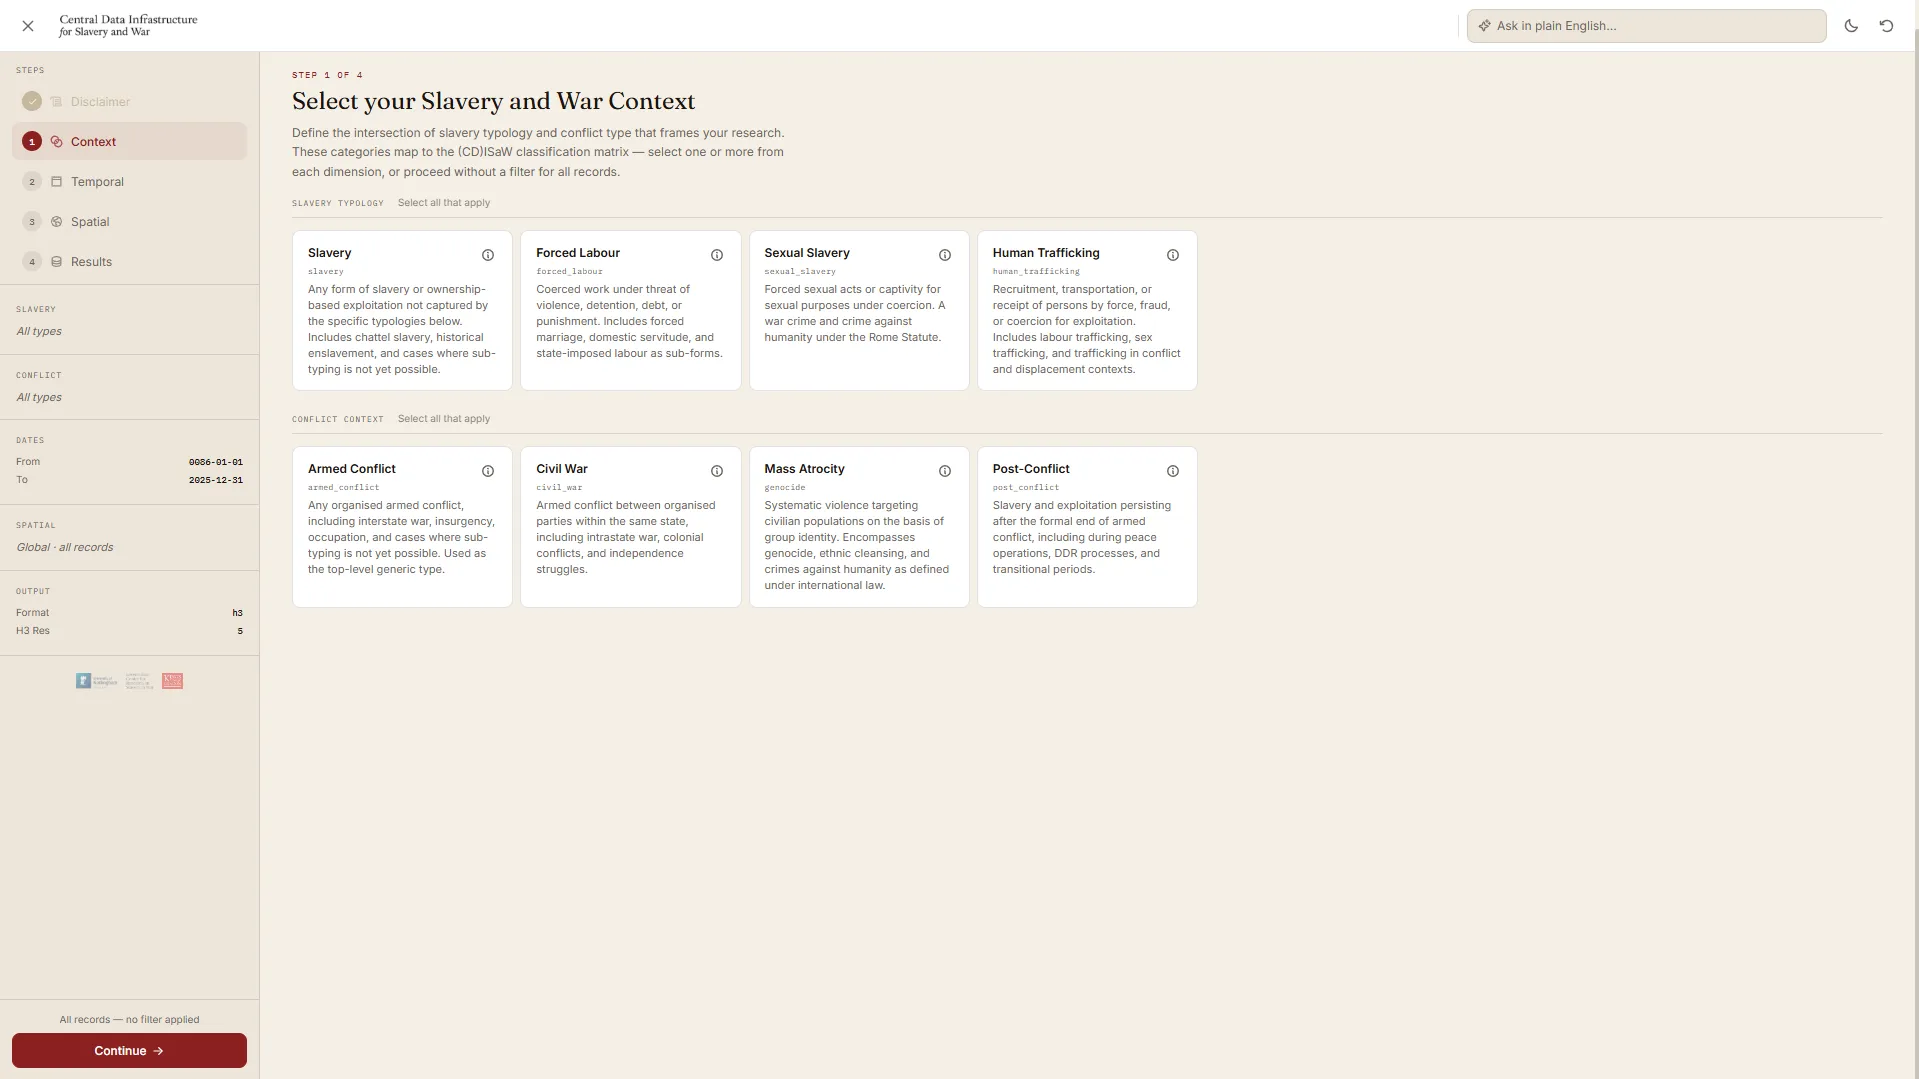
Step 1 of the query wizard, showing slavery typology and conflict context categories as selectable cards with definitions.
Fig. 1

Step 1 of 4. The research question is stated first, as an intersection of slavery typology and conflict context, with each category carrying its legal or scholarly definition on the card. Everything downstream is a filter on this.

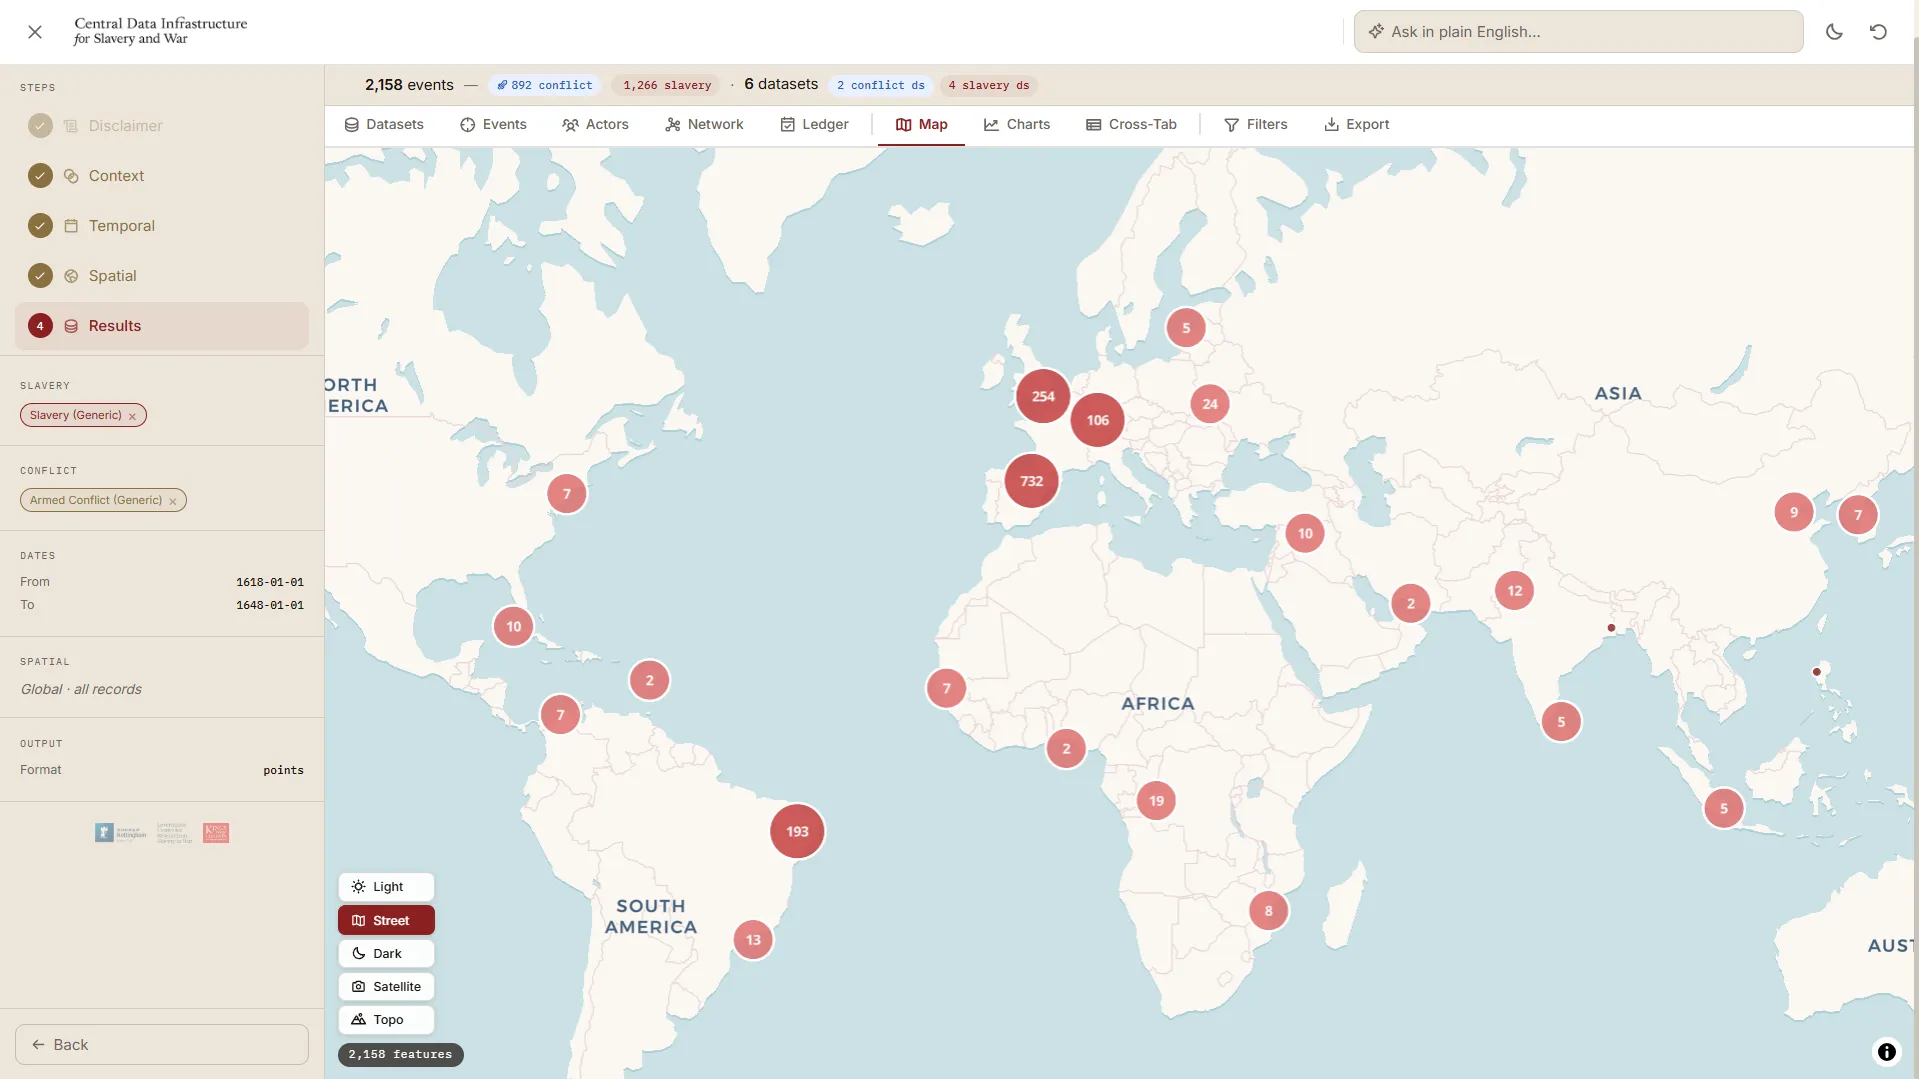
The map results view showing clustered event counts across Europe, Africa, the Americas and Asia for a 1618 to 1648 query.
Fig. 2

Results for generic slavery within armed conflict, 1618 to 1648: 2,158 events drawn from 6 datasets, clustered geographically. The tab row is the point, since the same result set is also available as events, actors, a network, a ledger, charts and a cross-tabulation.

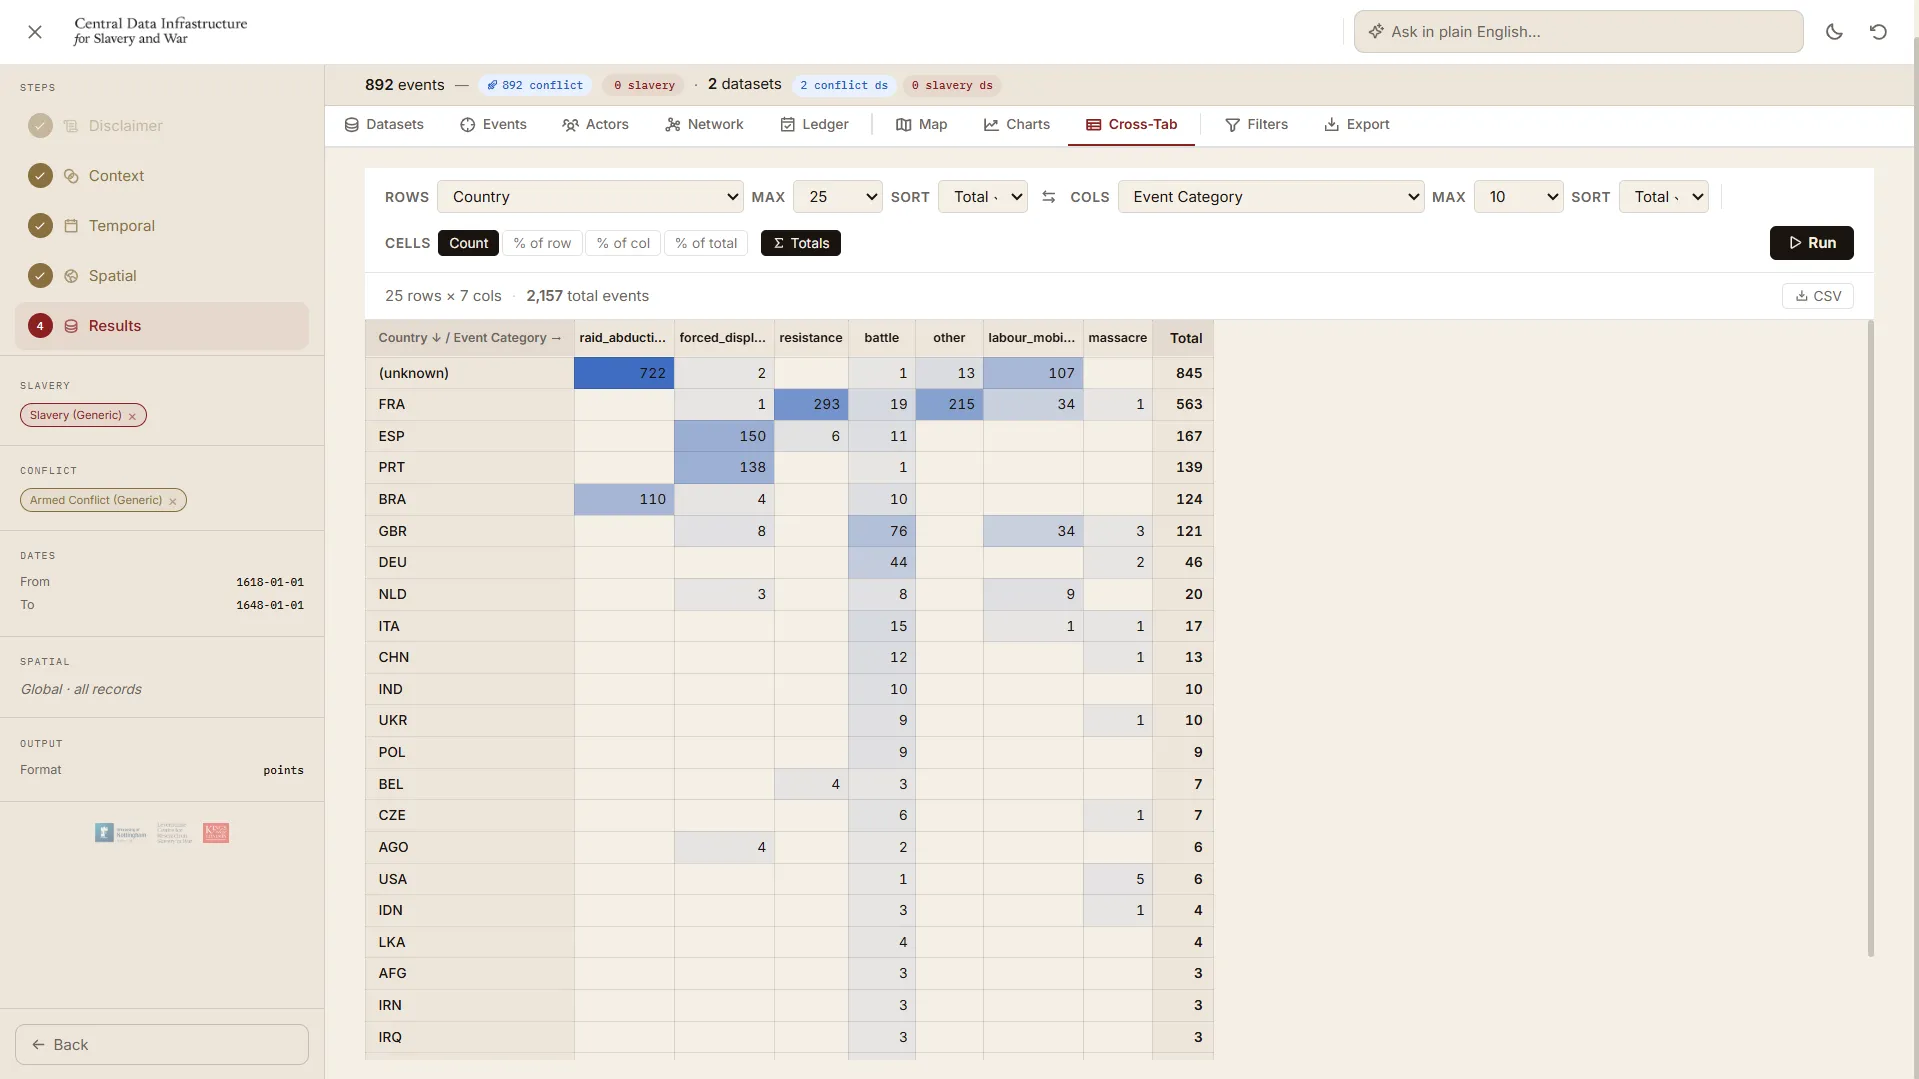
The cross-tabulation view showing counts across two selected dimensions of the result set.
Fig. 3

Cross-tabulation across the result set. Because the layers are explicit rather than flattened into a properties bag, any two dimensions can be tabulated against each other without leaving the platform.

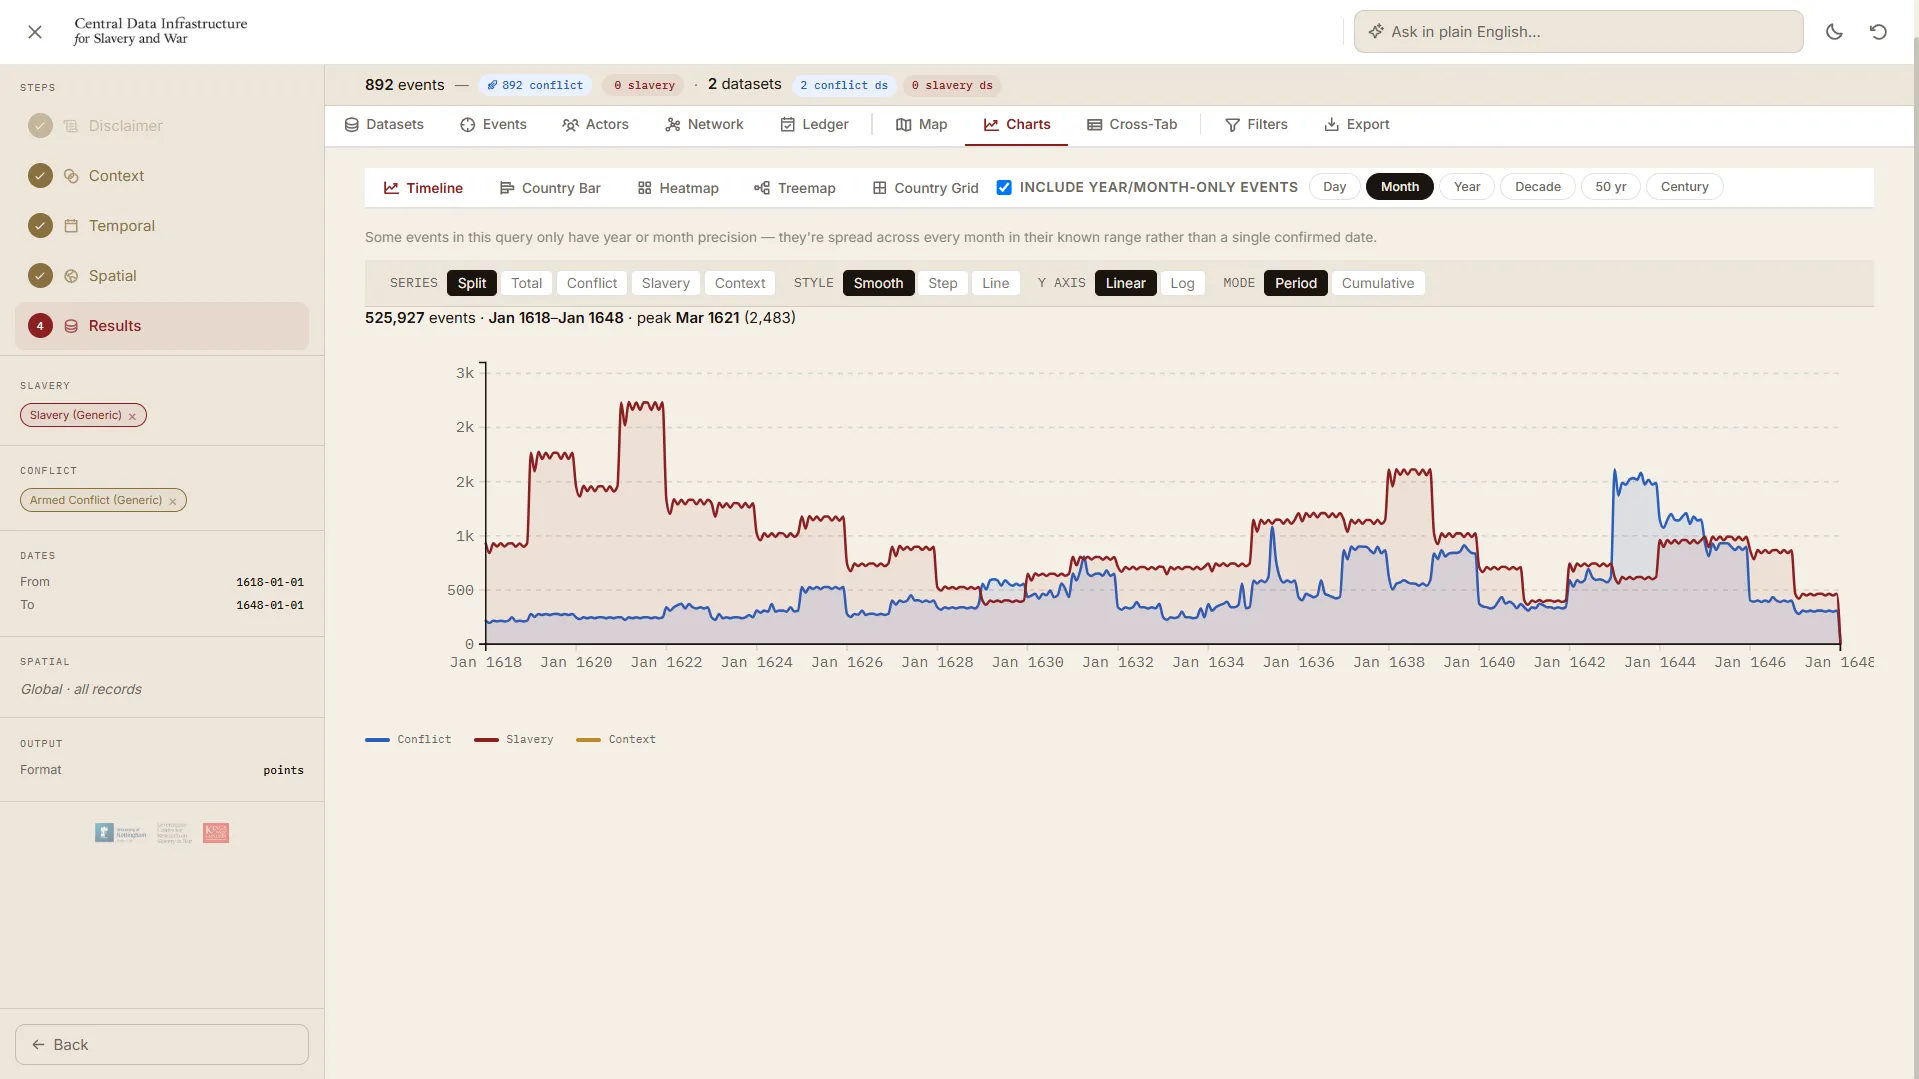
A timeline view showing event distribution over time by country.
Fig. 4

Temporal distribution by country. Variable precision is preserved throughout, so a record dated only to a year is never silently rendered as though it were dated to a day.

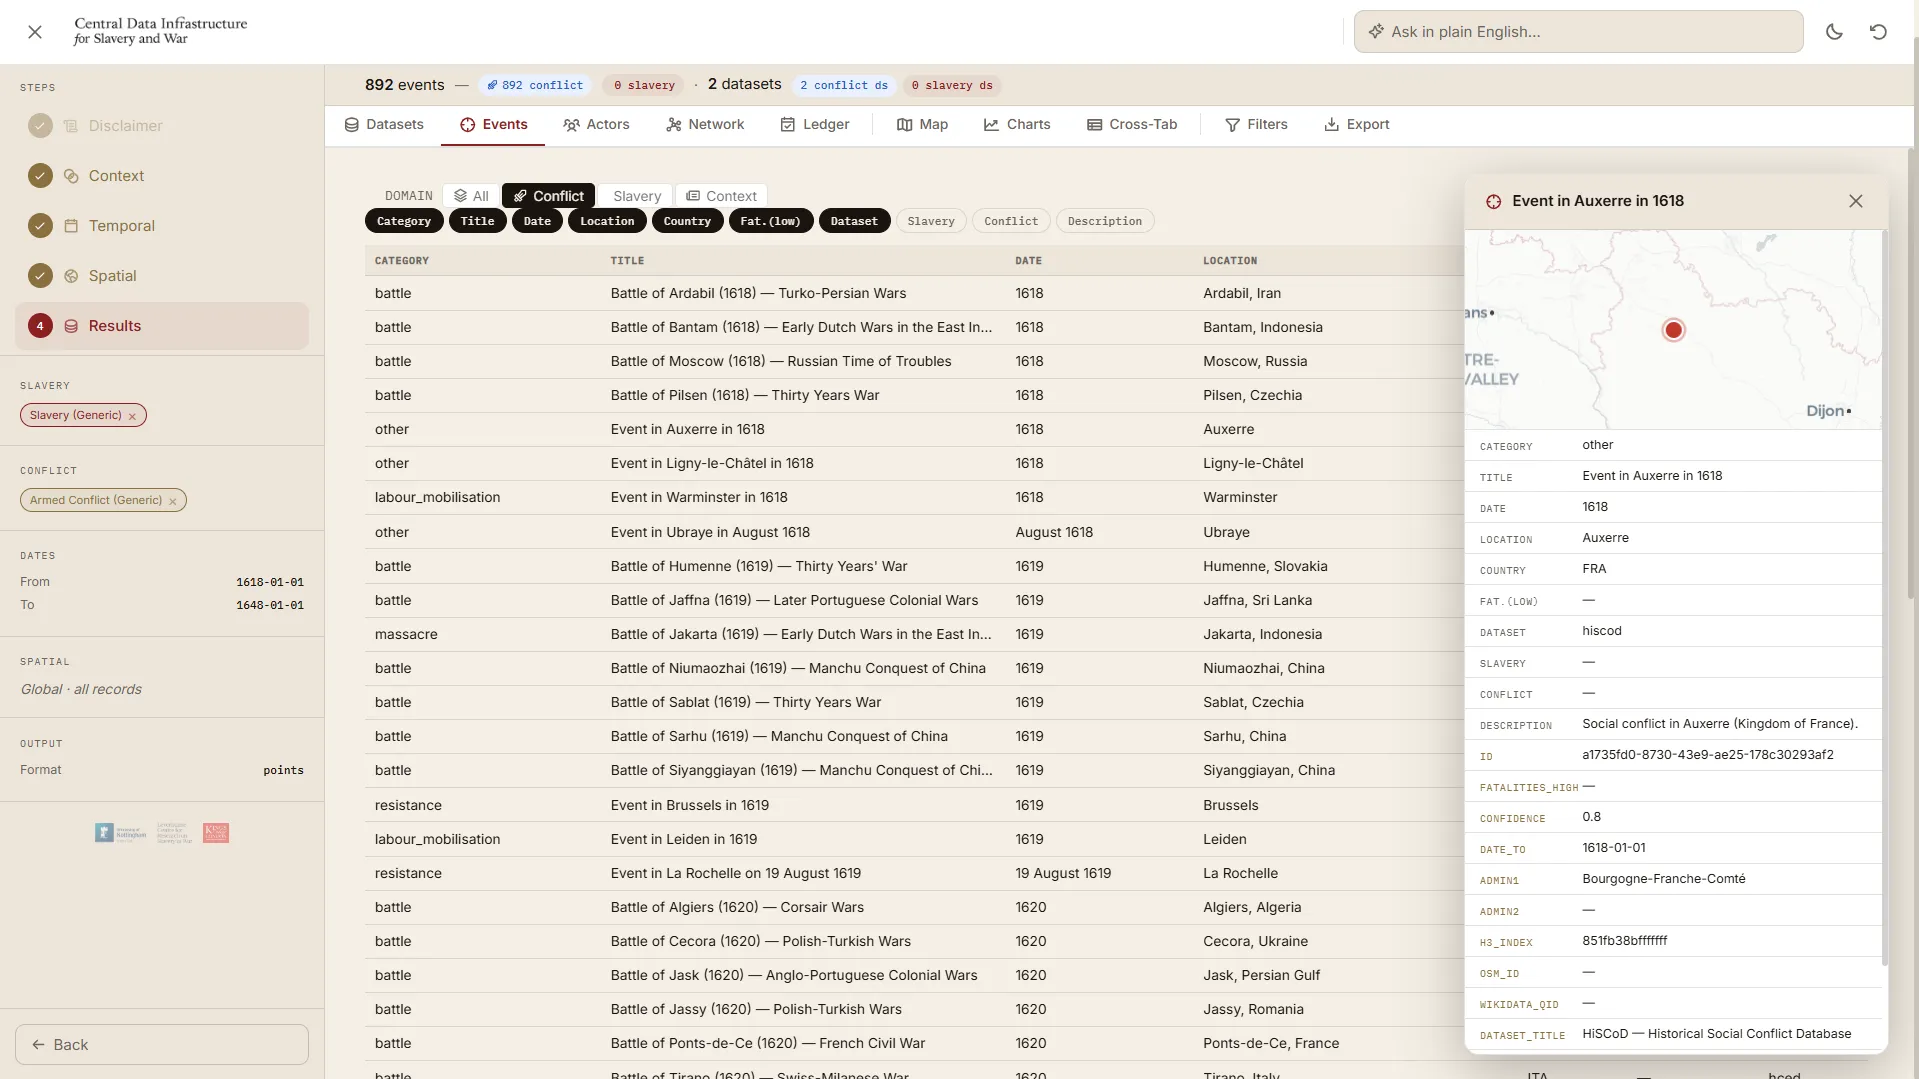
The event records view showing georeferenced events in a sortable table with source attribution.
Fig. 5

The underlying records, with source attribution intact. Normalisation makes the corpus comparable and every row still points back at the dataset it came from, which is what makes a result auditable.

Outcomes

  • Comparison without bespoke scripting

    Comparing forced labour across civil wars, or tracing sexual slavery through colonial conflicts, previously meant manually reconciling sources that were never designed to meet. That reconciliation now happens once, in the ingestion layer, rather than once per research question.

  • A theoretical claim, made operational

    Putting the classification matrix first in the query flow encodes a position: the intersection of slavery type and conflict type is logically prior to when and where. The interface does not merely permit that ordering, it requires it.

  • Reproducibility extended to the query

    Computational social science can cite a dataset but usually cannot cite the analytical operation performed on it. A CDQ code is a persistent, human-readable reference to a specific cross-layer query, which makes a published finding checkable rather than merely sourced.

  • Built to absorb a moving field

    New sources are catalogued and ingested by writing a connector configuration, with no change to core platform code. The source landscape in this field keeps shifting, and the architecture assumes that rather than resisting it.

Stack

API and services
FastAPI, asyncpg, Python 3.12, nginx
Data
PostgreSQL 16, PostGIS, Elasticsearch 8.13, Redis 7, MinIO
Spatial
Uber H3 resolutions 0 to 15, geometry(Point, 4326), ST_Within, MapLibre GL
Ingestion
REST, CSV, GeoJSON, SQLite, Shapefile, OGC WFS, SPARQL
Matching
pg_trgm fuzzy search, Wikidata QIDs, ACLED actor IDs, ICTY case references
Deployment
Docker Compose v2, 8 containers across query and ingestion clusters
  • Leverhulme Centre for Research on Slavery in War
  • Rights Lab
  • University of Nottingham
  • King's College London

Designed for the Forecasting strand of the Leverhulme Centre for Research on Slavery in War, Rights Lab, University of Nottingham.

Work like this

Start a
conversation →

Available for consulting engagements and research collaborations at this scale. Email james@jameswil.com.